A Correlation Study of Liver Biopsy Appearances, Serum HBV DNA and HBsAg Quantification Levels of Nigerian Patients with Chronic Liver Disease
Author'(s): O.A. Betiku1* FMCPath, O. Adekanle2 FMCP, D.A. Ndububa2 FWACP, AGAF, and O.S. Ojo1 MD
1Departments of Morbid Anatomy, Obafemi Awolowo University College of Health Sciences, Ile-Ife, Nigeria
2Internal Medicine, Obafemi Awolowo University College of Health Sciences, Ile-Ife, Nigeria
*Correspondence:
Betiku OA, Departments of Morbid Anatomy, Obafemi Awolowo University College of Health Sciences, Ile-Ife, Nigeria
Received: 25 Aug 2022 Accepted: 23 Sep 2022 Published: 28 Sep 2022
Citation: O.A. Betiku, O. Adekanle, D.A. Ndububa, et al. A Correlation Study of Liver Biopsy Appearances, Serum HBV DNA and HBsAg Quantification Levels of Nigerian Patients with Chronic Liver Disease. Gastroint Hepatol Dig Dis. 2022; 5(2): 1-9.
Abstract
Background: Infection with the hepatitis B virus is highly endemic in much of sub-Saharan Africa where it remains an important cause of chronic ill-health. Quantitative assay of HBV DNA and HBsAg are emerging as useful tools in the management of chronic HBV infection. However, it is not yet clear how well each of these might accurately correlate with the extent of liver damage during the course of the disease. Nevertheless, liver biopsy, albeit an invasive test, affords a superior direct assessment of all stages of the disease.
Objective: Thus, we set out to determine how well-correlated serum levels of HBV-DNA and/or HBsAg might be with each other and with the liver biopsy appearances.
Methodology: This study was prospective and we enrolled, 83 new treatment-naïve patients, who met the study criteria. Each patient had liver biopsy assessments of the grade of necroinflammation (A) and stage of fibrosis (F), according to the METAVIR Scoring System. In addition, quantitative HBsAg serum levels by immunoassay and HBV DNA by real-time quantitative PCR protocols were made. The Spearman’s and Kruskal-Wallis statistical tests were employed to determine the correlations between these assays separately and with the respective histological grades and stages of liver biopsy. (p=0.05)
Results: The greatest number of the patients were within the 21-40 year- age group. Using the Spearman rho’s statistical correlation test, we found a positive but weak correlation between the serum HBsAg and HBVDNA levels (p=0.075, r=0.198). The Kruskal-Wallis analysis revealed statistically significant correlation between HBV-DNA and the grade of necroinflammation but not with the stage of fibrosis.
Conclusions: We found that the serum HBV DNA levels had the only statistically significant correlation with the liver histological disease. This relationship needs to be further examined in larger studies in the future.
Keywords
Introduction
Some two billion people worldwide (or one-third of the global population) are infected with the The Hepatitis B virus. Of these, approximately 240 million are chronically infected with the virus [1,2]. Nigeria is among countries with the highest HBV burden in Africa with an average national prevalence of between 11% and 13.6% [3,4]. The current national HBsAg sero-prevalence is 8.1 percent. It is estimated that 1%-5% of acute infections in adults progress to chronic HBV (CHB)-infection which can lead to complications such as cirrhosis or hepatocellular carcinoma (HCC) [4].
The evaluation of a patient with chronic HBV disease involves a wide range of laboratory tests to assess the associated liver disease. However, it is still generally agreed that liver biopsy still remains the gold standard to grade and stage the disease.
The quantitative and qualitative estimation of HBsAg have been evaluated and correlated with the severity of the liver disease on liver biopsy [5], while HBV DNA, a marker of viral load, is useful in prognosticating HBV infections [6]. It is also interesting to know that the viral load has been linked with the severity of CHB infection [7].
The yet to be a fully clarified relationship between serum HBsAg and HBV-DNA level on one hand and the possible correlation between these surrogate markers of CHB with liver histology on the other, provided the ratonale for our study. Thus, we set out to determine the possible correlations, if any, between liver biopsy, HBV-DNA and HBsAg quantification level in HBV associated Chronic Liver Disease in patients seen at our hospital over a one-year period.
Materials and Methods
We selected a cohort of treatment-naïve, first-time attendees of our Hepatology Clinics of our hospital between 1st August 2018 and 31st July 2019. Ethical approval for the study was obtained from the hospital’s Ethics and Research Committee.
To be included in the study patients had to satisfy some inclusion criteria, which included CHB patients defined by HBsAg positive for more than 6 months or being positive for anti-HBc (Total) but negative for IgM anti-HBc and anti-HBs. They also had to be treatment-naïve, not having commenced recommended antiviral treatment for their hepatitis B virus infection. We excluded patients who had any liver-related comorbidity caused by HCV and immunodeficiency virus co-infections as well as patients with an incidental diagnosis of HCC or liver dysplasia on liver biopsy were also excluded.
The study procedures were as follows:
a. Patients Biographical Details and Medical Records
Patients were recruited into the study after informed consents were obtained. Following the selection of the patients a standardized proforma was used to obtain sociodemographic data (age and gender), in each case.
b. Serum HbsAg and HBV DNA Studies
- Blood collection, processing, and storage
Venous blood was obtained by standard sterile phlebotomy protocol. The blood sample was transferred into a plain specimen bottle, allowed to clot and retract for two hours. Blood samples were spun in a centrifuge at 3000 rpm for five minutes. The separated sera were kept frozen at -80 degrees until analysis.
•Laboratory Analysis
Laboratory analysis was carried out to estimate the following parameters;
- Serum quantification of HBV DNA
- Serum quantification of HBsAg
The serum HBV-DNA levels were measured by real-time polymerase chain reaction (PCR) using Roche molecular systems, Roche Diagnostic according to the manufacturers’ protocol. This was carried out at the Institute of Human Virology Laboratory of our Hospital.
Also, the serum level HBsAg was measured using commercial automated immunoassay for HBsAg detection and quantification manufactured by Siemen in SYNLAB in Istanbul Sisli Laboratory Turkey branch. These were done following the manufacturers’ protocol [8].
Liver Biopsy Studies
A core of liver tissue about 1.5-2cm deep into the liver was suctioned with the Menghini needle. In each case the liver tissue so obtained was fixed in 10% buffered formalin and eventually subjected to Haematoxylin & Eosin, Masson’s Trichrome stains for histology and subsequent staging and grading was carried out using the METAVIR Scoring System [9].
Data Analysis
Data were analysed using the Statistical package for social science (SPSS) version 20 (SPSS Inc., Chicago, IL, U.S.A). First, the univariate analysis was performed for the age and sex. The demography was analyzed using calculations of frequencies and percentages and these were expressed in tables and graphs.
Correlation studies
The Spearman rho and Kruskal-Wallis correlation statistical test were employed in the analyses. This statistical analysis was aimed at revealing the nature of the correlation between the degrees of necroinflammation and stage of fibrosis and the quantitative levels of HBsAg or HBV DNA, which are dependent variables.
The nature of the correlation between these variables, whether negative or positive were sought regardless of the nature of their dependence. The level of statistical significance was set at P<0.05, where applicable
Results and Data Analysis
Demographical Characteristics of the Study Patients
The numbers of males were 58 (70.4%) and 24 (29.6%) for females. The male to female ratio was (2.4:1). The mean age of the patients was 36.49 ± 9.77 years, ages ranged from 21 to 62 years. The modal age was 30 years while the median age was 36 years.
The age group distribution is shown in figure 1. The highest number of patients fell within the age group of 31-40 years for both males and females. This accounted for 37.9% and 37.5% for males and females respectively. The lowest number of patients was within the 41-50 age group in both males and female patients. Similarly, they made up 3,4% and 12,5% in males and females respectively (Figure 1).
Distribution of serum HBsAg levels
The histogram in Figure 2 shows the distribution of HBsAg among the study population. The histogram depicts the values of serum levels of HBsAg, which were obviously not normally distributed. The model values of HBsAg levels were multiple and the smallest value was 0.04 IU/L. The range of serum HBsAg levels was
0.04 IU/L to 1687748.00IU/L; the mean value was 56825.26 ± 259382.89 IU/L and the median was 8540.12 IU/L. The outlier values were prominent.
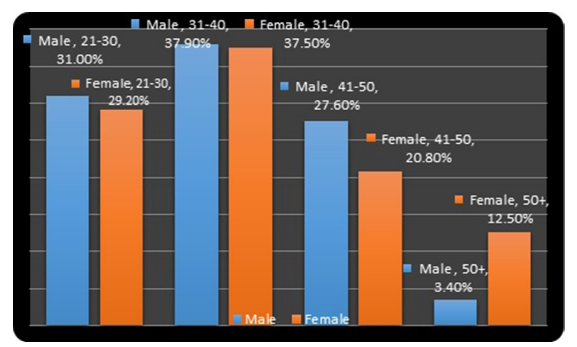
Figure 1: The Bar Chart shows Percentages of CHB Patients by Age- group and gender.
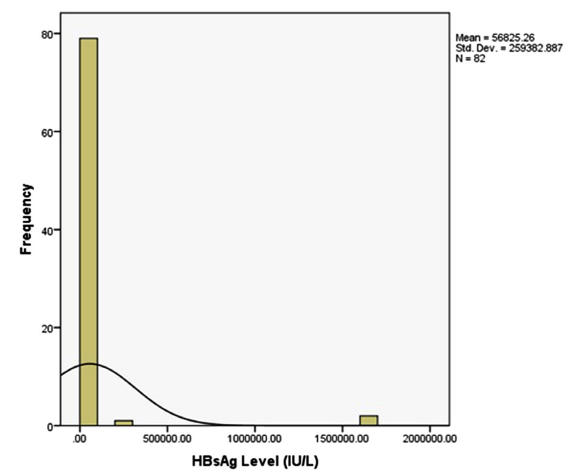
Figure 2: Histogram Depiction of the Distribution of Serum HBsAg Level.
The relationship between the mean serum levels of HBsAg and the age group is represented on the graph figure 3. The highest serum levels of HBsAg was associated with the lowest age group. The serum levels of HBsAg apparently gradually fell as the age group increased. The lowest serum levels of HBsAg were less than 1000 IU/L and was seen in the 41-50 years’ age group.
Distribution of serum HBV-DNA levels
The histogram in Figure 4 shows the distribution of HBV-DNA among this study population. The modal serum levels of HBV-
DNA were 20 IU/ml. The mean of serum levels HBV-DNA was 812379.79 ± 6274489.46 IU/ml; the median was 558.00 IU/ml.
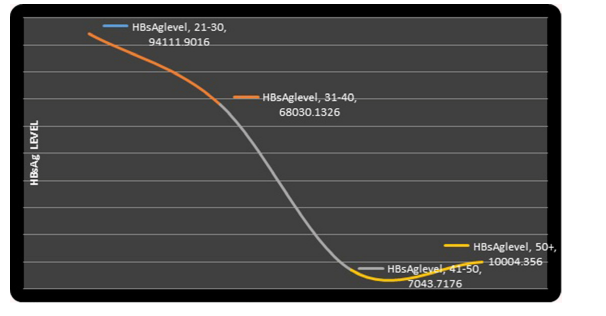
Figure 3: Graph showing the Trend of Serum HBsAg Levels and Various Age Groups.
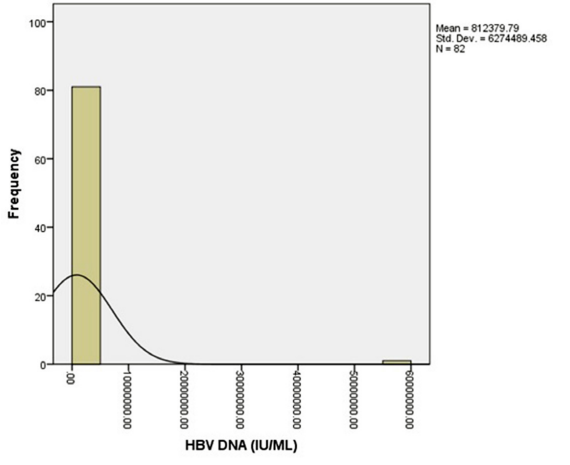
Figure 4: A histogram Depiction of the Distribution of Serum HBV-DNA Levels.
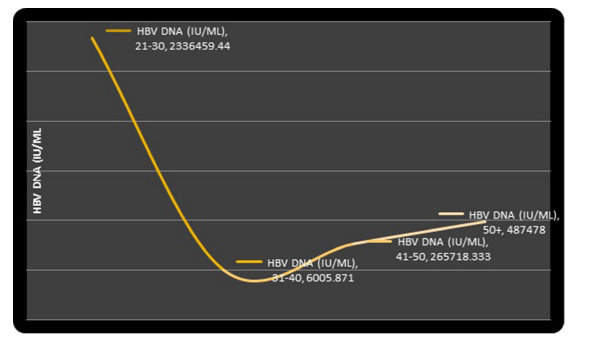
Figure 5: Graph Showing the Trend of Serum HBV-DNA Levels with Age Groups.
The relationship between HBV-DNA values and the age groups is shown in figure 5. The youngest age group was observed to be associated with the highest serum levels of HBV-DNA.
Comparison of HBsAg and HBV-DNA
The Spearman rho’s correlation test also shows a very weak positive correlation between serum levels of HBsAg and HBV DNA (p=0.075, r=0.198) among the cohort. This meant that as HBsAg increased the HBV DNA also increased. This relationship was however not statistically significant.
The Scatter Diagram in Figure 6 shows the association between serum levels of HBsAg and HBV DNA. There was no clearly observable pattern in the relationship between these two variables.
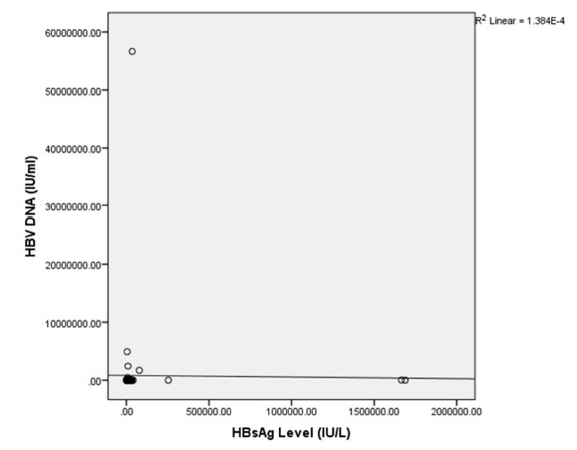
Figure 6: Scatter Diagram Shows the Relationships Between Serum HBV DNA and HBsAg Quantification Levels.
Distribution of Histological Grading and staging using the METAVIR scoring system.
Close to four percent (3.7%) of the cases had no evidence of necroinflammation (A0) METAVIR score, 51.2% had A1 (mild necroinflammation), 24.4% had A2 (moderate necroinflammation) while 20.7% had A3 (severe necroinflammation).
Also, 12.2% had no evidence of fibrosis (F0) METAVIR score, 37.8% had F1 (mild fibrosis), twenty-eight percent had F2 (moderate fibrosis) while twenty-two percent had F3 (severe fibrosis). There is no case with F4 score (definite cirrhosis).
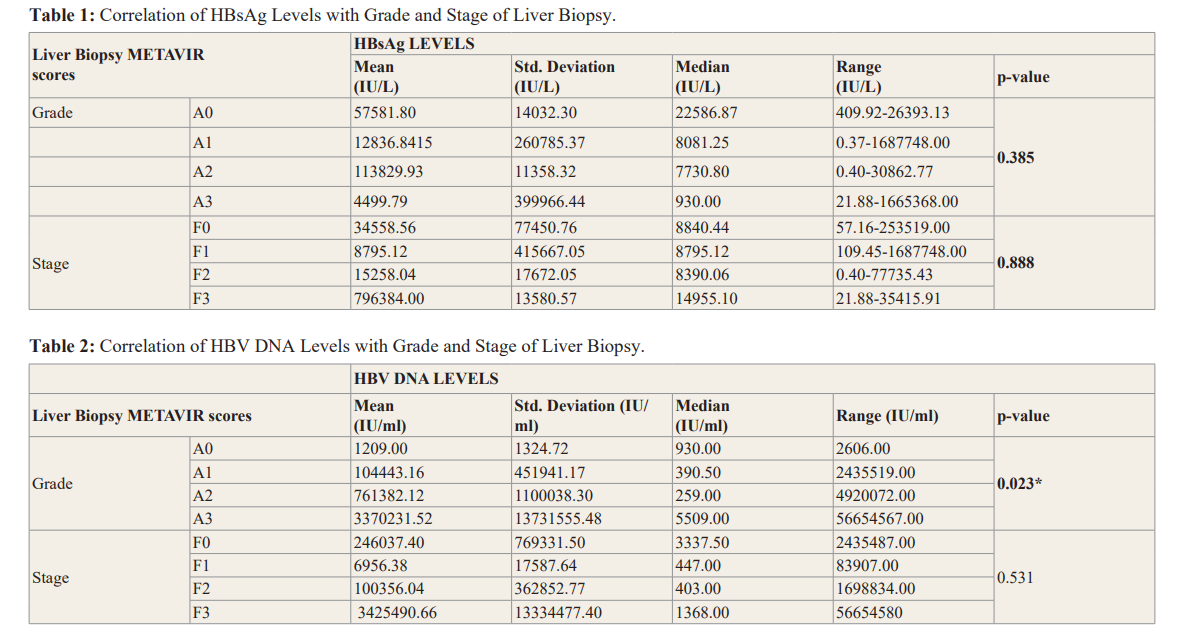
Correlation of HBsAg with Grade and Stage of Liver Biopsy The highest histological grade of necroinflammation observed was also grade A3 while for the stages of fibrosis it was F3. Few patients had nil necroinflammation (A0) and nil fibrosis.
As the grade of necroinflammation worsened, the median serum levels of HBsAg decreased. There was no statistically significant correlation between the serum levels of HBsAg and grades of necroinflammation (p-value = 0.385) (Table 1).
The range of HBsAg levels in patients with nil necroinflammation (A0) was 409.90 IU/L to 26393.13 IU/L; the median value was 22586.87 IU/L. The range of HBsAg levels in grade A1 of necroinflammation was 0.37 IU/L and 1687748.00 IU/L while the median was 8081.25 IU/L. Grade A2 had a range of serum HBsAg levels between 0.04 IU/L and 30862.77 IU/L and the median HBsAg level was 7730.80 IU/L.
The box-plots in figures 7 and viii show the distribution of HBsAg across different grade of necroinflammation and stages of fibrosis in patients with chronic Hepatitis B infection. The extreme outlier value made the box plot to be very small, close to each other and difficult to interpret. However, from the box-plot, the median of almost all the grades of necroinflammation are very close to each other.
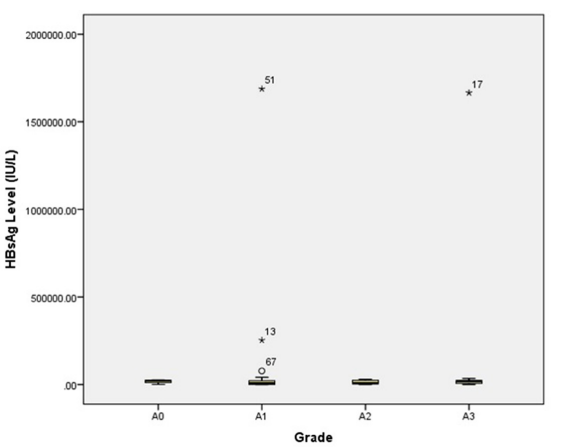
Figure 7: Box-plot Showing the Distribution of HBsAg Across Different Grade of Necroinflammation.
Similarly, the stage of liver fibrosis did not correlate with the HBsAg levels (P-value = 0.888). The range of HBsAg level in patients with nil fibrosis (F0) was 57.16 to 253519.00 IU/L and the median was 8840.44. The interquartile range was 18498.55 IU/L. The range and median values of the F1, F2, and F3 are shown in table (2).
Comparison of the liver biopsy appearances with the serum levels of HBV DNA
A significant correlation was observed between the serum levels of HBV DNA and the different grades of necroinflammation (P-value = 0.023) when the Kruskal-Wallis Test was applied. The range of HBV DNA in patients with nil necroinflammation A0 was 46.00 IU/ml and 2651.00 IU/ml, the median was 930.00 IU/ml and no outliers were observed. Likewise, A1 had a range between 20.00 IU/ml and 243539.00 IU/ml; a median of 390.50 IU/ml (Table 2).
The box-plot in Figures 8 and 9 shows the distribution of HBV- DNA among the different grades of necroinflammation. There were four outliers observed in grade A1 of necroinflammation, two outliers for grade A2 and one outlier for grade A3.
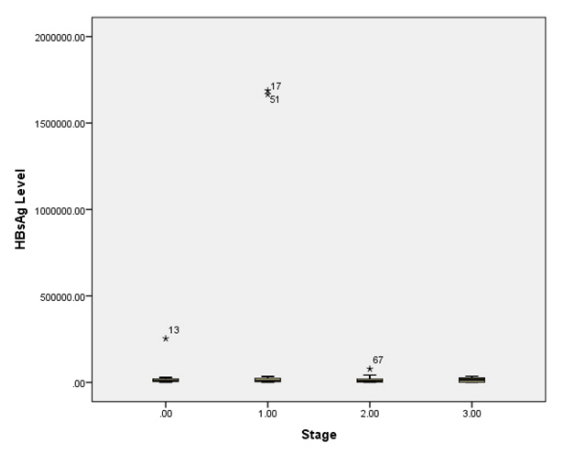
Figure 8: Box-plot Showing the Distribution of HBsAg Across Different Stage of Fibrosis.
Contrary to our observation regarding their significant relationship with the grades of necroinflammation, HBV DNA levels did not significantly correlate well with the different stages of fibrosis in this cohort of patients with CHB infections (P-value =0.531). The median values of HBV-DNA levels were also proximate for grade F1 and F2 stages of fibrosis. The median serum levels of HBV DNA were 447.00 IU/ml and 403.00 IU/ml respectively.
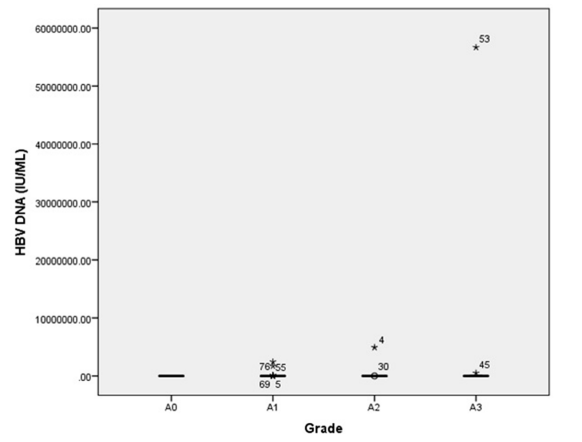
Figure 9: Box-plot Showing the Distribution of HBV DNA Across Different Grades of Necroinflammtion.
The total number of outliers were also many and these were spread all through the stages of fibrosis as shown in figure 10. The range and the median serum levels of HBV-DNA for each stage are represented on the table 2.

Figure 10: Box-plot Showing the Distribution of HBV DNA Across Different Stages of Fibrosis.
Discussion
Demographic Characteristics of the Study Patients.
The study involved 82 cases out of which we found more males. This finding concurs with reports from previous relevant studies [10-12]. Hepatitis B virus infection has been found to be particularly more prevalent in males in Nigeria and other Sub-Sahara African countries [3]. Generally, men are more predisposed to the common risk factors for HBV infection like sharing sharps and circumcision [3,13,14]. Also, men who are infected with HBV are more likely to progress to a chronic form of infection. This might be due to the reported protective influence of oestrogen on hepatocytes against the development of chronic liver disease in women [13]. A latter study putatively put this down to the effect of an abnormal protein (Apolipoprotein A-1) involved in inflammation in male patients infected with HBV [15]. This abnormal protein is however not present in women, suggesting that this protein may play a role in predisposing male patients to CHB [15].
As expected, the overall mean age 36.49 ± 9.77 years of this cohort is comparable and similar to that observed in studies among chronic hepatitis B patients in south-west Nigeria [11,16], and Northern Nigeria [17]. The mean age in sub-Sahara Africa is similar where the infection is also endemic [1]. However, this is dissimilar to the findings in an Indian study in which the mean age is 22.3 ± 3.1 years [18].
Young age at acquisition of hepatitis B virus infection is a predictor of progression to the chronicity of the infection [19]. Chronic hepatitis B infection was most commonly found among patients between the ages of 21 and 40 years in this study. A relatively youthful population, as we found here, is the predominant feature in the regions of high endemicity such as Nigeria and much of sub-Sahara Africa because the mode of transmission is vertical although a large proportion are also horizontal, mostly during early childhood and preschool age. This may explain the similarity in the mean age compared to several similar studies on CHB as ours [4,7]. HBV infection occurs in approximately the same pattern in other countries of high HBV endemicity such as Guangdong province in China [10,20].
Distribution Patterns of serum HBsAg levels
The mean serum HBsAg levels found among our study cohort was 56825.26 ± 259382.89 IU/L. This mean is higher when compared with another study by Varghese Thomas et al5 from Kerala state in Indian. However, this dissimilarity by Varghese et al. [5] study may be due to the smaller sample size of fifty-two in their study which was lower and very different from the sample size obtainable in our study.
Jaroszewicz J et al. [21] had reported that pre-existing high serum HBsAg levels are often associated with the subsequent development of HCC. The higher values we got might probably in part, explain the high prevalence of complication of CHB. Many of our patients remain asymptomatic for long period and, frequently only present late with the complications of the disease such as cirrhosis and hepatocellular carcinoma at their first hospital liver admission or clinic attendance.
The serum HBsAg levels decreased as the age increased in this study. Similarly, a two-fold reduction was observed as the course of HBV infection progressed in another study by Zeng et al. [22]. This finding is also consistent with Jaroszewicz et al. [21] in which highest hepatitis B surface antigen levels was found during the immunotolerant phase. Another European study also revealed the highest values in the immunotolerant phase and the majority of patients in the low replicative phase had the lowest serum HBsAg levels [21]. In the low replicative phase, patients are normally HBeAg negative. It is possible that most of the patients in this study were HBeAg negative but we cannot ascertain this as the HBeAg status was not considered in this study.
HBV genotype has been thought to influence the relationship between serum HBsAg and HBV replication. Tuaillon et al. [23] in a comparative study found a correlation between HBsAg level and HBV-DNA for genotype A and there was no correlation observed for genotype D. Generally, genotypes have different geographical distributions. Genotype A. D and E occurs in Africa, although genotype E is predominant in western African [24], and Nigeria [25].
Distribution Patterns of serum HBV-DNA levels
The mean serum HBV DNA was 812379.0 IU/L in this study. The higher value recorded for our cohort concurs with mean serum HBV DNA level observed in a similar prospective study in Indian5 which also demonstrated a higher mean value. This higher figure for prospective compared to that of a retrospective study by Zeng et al. [22] in china may be attributed to the fact that our prospective study was treatment naive. This comparison may not be totally true because our methodologies differ.
The serum HBV DNA values among our subjects’ decrease with increasing age. This finding is in contrast to a retrospective study in Fujian China, in which serum HBV DNA increased as the age increased in the course of the chronic HBV infection [22]. Also, in the China study, the serum HBV DNA levels decreased after seroconversion from HBeAg positive to negative. This may suggest that the immune response against HBV becomes more effective as the patient grows older.
Correlation of Serum Levels of HBsAg and HBV-DNA
The determination of the serum HBsAg levels and HBV DNA provides different but complementary information. Whereas serum HBsAg levels reflect the translation of messenger RNAs from transcriptionally active cccDNA, serum HBV DNA levels are a reflection of viral replication. It is known that the cccDNA in the hepatic nucleus serves as a template for the transcription of four groups of viral RNA [26]. The mRNA undergoes translation in the cytoplasm into viral proteins. The proteins are subsequently secreted into the serum as either complete Dane particles and/ or empty subviral spheres and tubules, which together constitute what is quantified in the serum as HBsAg [26]. Therefore, HBsAg and HBV DNA are closely related and expectedly positively correlated.
We found a weak but positive correlation in this study. Other studies reported a significant positive association between serum HBsAg levels and HBV DNA in CHB infected patients [7,27,28]. The association between HBsAg and HBV DNA has been found to be stronger in HBeAg-positive than in HBeAg-negative CHB patients [27].
Overall, the correlation between the serum HBsAg and HBV DNA levels among our patients did not reach levels of statistical significance. This is in conformity with a study by Gang et al. [29] in which they found no significant correlation between serum HBsAg and HBV DNA levels and therefore concluded that serum HBsAg level could not be used as a surrogate marker for HBV DNA [29]. In the study by Jaroszweicz et al. [21] they demonstrated a weaker correlation between the serum HBsAg and HBV DNA level when the patients were separated into 2 groups on the basis of whether they were HBeAg negative or HBeAg positive and analysed separately. However, the correlation was statistically stronger when the two groups (HBeAg-positive and HBeAg-negative) were combined and analysed together. The reason being that, more HBsAg may be generated from integrated HBV DNA in addition to those from cccDNA as the disease progresses. That is both the cccDNA and the integrated HBV DNA can produce viral proteins. This may mean that some percentage of the HBeAg negative group have mutant HBV virus. A mutant HBV virus does not produce HBeAg. But such patients harbor replication-competent HBV variants and thus, retain or develop high serum HBV DNA levels [30]. This may contribute to stronger association observed when data from sera with both statuses were analysed together.
Apart from the HBeAg status, the immunological phase of the disease that a patient is, appears to also affect the relationship between the serum levels of HBsAg and HBV DNA [22]. It has also been suggested that the genotype of the infecting HBV may affect this relationship as well [23,31]. The inconsistent correlation between HBV DNA and HBsAg levels may be related to the fact that the serum levels is determined by the translation mRNAs for the ‘S’ gene generated from the cccDNA in addition to the translation of integrated HBV DNA sequences within the host genome. The serum levels decline during the transition from the active to the inactive phase.
The HBeAg statuses, the immunological phase of the disease or the genotype of the infecting HBV were not considered in our study. We hope to do this in an expanded prospective study in the future so as to clarify this issue among our patients at Ile-Ife.
Correlation of Serum HBsAg Levels with Histological Grade and Stage of Liver Biopsy
Generally, we found that a greater proportion of our patients fell within the necroinflammation grade A1 and the fibrosis stage score F1 in the distribution of the METAVIR scores. In this study, we found no correlation between the serum HBsAg levels and the histological grade of necroinflammation and the stage of fibrosis. Our finding concurs with that of the Indian study in which serum HBsAg levels did not show any correlation with the histology activity index using the Knodell score [5]. On the other hand, our finding is in contrast to a Chinese study by Jing et al. [28], in which HBeAg-positive CHB patients with insignificant fibrosis had lower levels of HBsAg [28]. In fact, they found a positive correlation between levels of HBeAg and HBsAg and a stronger correlation between levels of HBeAg and HBV DNA. However, the relationship between levels of HBeAg and liver fibrosis remained unclear. In that study, they sought to identify quantitative biomarkers that might serve as a tool for the evaluation of liver fibrosis in treatment-naïve CHB patients.
At the end of the study by Jing et al. [28], 4.15 log10 IU/ml levels of HBsAg was said to be predictive of significant fibrosis in HBeAg positive patients. In another study, high HBeAg levels was found to predict liver fibrosis [32].
In conclusion, we found that serum levels of HBsAg bore no correlation with the grades or stage of the liver disease. However, in the light of the conflicting findings by other workers, this issue is obviously deserving of further exploration in a larger prospective cohort of Nigerian patients.
Correlation of the liver biopsy appearances with the serum levels of HBV-DNA
In this study, we observed that there was a significant correlation between serum level of HBV-DNA with the grade of necroinflammation, but no correlation whatsoever with the stage of fibrosis. The reason for the difference between the unequal correlation of grade and stage of fibrosis may be multifactorial and may not be unrelated to the fact that many of the patients may be in their early stages of liver disease.
Our findings were in discordance with those of a retrospective study by Jie Shao and co-workers [33], who did not find a correlation between serum HBV DNA and liver biopsy appearance in the HBeAg-negative or HBeAg-positive CHB patients.
Also, there was a significant correlation in the grades of necroinflammation and serum HBV DNA levels in contrast to the findings by Thomas et al. [5]. Thomas had studied 52 patients prospectively and graded the necroinflammation by the Modified HAI scoring system, but reported no significant correlation between the serum HBV DNA and the grade of necroinflammation.
Clearly, there is a divergence of opinions regarding correlation of HBV DNA and the extent of liver histopathology. While some studies reported significant correlation, others did not find any. Gao et al. [34] found that as the severity of the fibrosis increased, the quantitative levels of HBV DNA tended to reduce gradually while other non-invasive APRI index increased in HBeAg-positive CHB patients. The levels of HBV DNA of 7.13 log10 IU/ml (1.35x10⁷ copies/ml) may predict significant fibrosis in the liver, they opined. Whereas in other studies, such as by Maryam et al, there was no significant differences in grade of necroinflammation and stage of fibrosis regardless of the HBeAg status [20].
Further, we observed that the highest values of serum HBV DNA were associated with the severest stages of fibrosis, this is in contrast to a study by Jing et al. [28]. In that study, using the Scheuer Scoring Scheme, lower serum HBV DNA levels were more frequent in those with moderate to severe (S2-S4) fibrosis in the HBeAg positive CHB patients while higher serum HBV DNA levels were found in those with moderate to severe S2-S4 fibrosis in those with HBeAg negative CHB patients.
However, a similar study by Fatee A. A et al in Egypt [35] selectively assessed the histopathological findings of liver biopsy from the inactive HBsAg carrier patients. The inactive carriers were those with persistently normal ALT levels and low serum levels of serum HBV DNA less than 2000IU/ml [35]. In the Egyptian study, serum HBV DNA level did not differ significantly regardless of the stage of fibrosis or necroinflammatory grade, using the Ishak Scoring System. The majority of the HBsAg carrier patients were observed to have stage 1 and 2 fibrosis and mild necroinflammation. In another African study similar to the one by Fatee A. A et al. [36], that used the METAVIR Scoring System, they obtained similar results although five out of nineteen of the patients had greater than F2 fibrosis in the inactive HBsAg carrier patients. Therefore, the level of liver damage is minimal in both. The actual nature of this relationship between HBV DNA and histological liver disease deserves further study in larger cohorts in the future.
Conclusion
Chronic hepatitis B liver disease remains predominantly a disease of the younger segment of our population and, while the serum HBsAg levels of our subjects did not correlate with either the grade of necroinflammation or the stage of fibrosis on liver biopsy, the serum levels of the HBV DNA correlated positively and significantly with the grade of necroinflammation but not with the stage of fibrosis. This relationship needs to be further examined in larger studies in the future, perhaps it could be of any clinical application.
Conflicts of interest: No conflict of interest declared
Acknowledgments
I acknowledged my institution OAUTHC Ile-Ife Osun State for granting me permission to carry out this research. I also thank Mr. Goke Aremu, Dr. Omoyiola Oluwatosin and Dr. Busuyi Oluwasogo for the supportive activities.
References
- Kew MC. Epidemiolgy of hepatitis B virus infection, hepatocellularcarcinoma, and hepatitis B induced hepatocellular carcinoma. Pathol Biol. 2010; 58: 273-277.
- Papastergiou V, Lombardi R, MacDonald D, et al. Global Epidemiology of Hepatitis B Virus (HBV) Infection. Curr Hepatol Reports. 2015; 14: 171-178.
- National Aids/STIs Control Programme FM of Guidelines for the Prevention, Treatment and Care of Viral Hepatitis in Nigera. Nigeria: Federal Ministry of Health,Abuja, Nigeria. 2016.
- Fattovich G, Stroffolini T, Zagni I, et al. Hepatocellular carcinoma in cirrhosis: Incidence and risk factors. Gastroenterology. 2004; 127: 35-50.
- Thomas V, Zacharia GS, Indusarath S, et al. Correlation between Serum Quantitative HBsAG and HBV-DNA Levels with Histological Activity Index and Hepatic HBsAg Expression in Liver Biopsy Specimens of Patients with Treatment Naive Chronic Viral Hepatitis B Infection. J Clin Exp Hepatol. 2014; 4: 16.
- Chen G, Lin W, Shen F, et Past HBV viral load as predictor of mortality and morbidity from HCC and chronic liver disease in a prospective study. Am J Gastroenterol. 2006; 101: 1797-1803.
- Amal Alghamdi, Nagwa Aref ME, Al-Hamoudi W, et al. Correlation Between Hepatitis B Surface Antigen Titers and HBV DNA saudi J Gastroenterol. 2014; 19: 252-257.
- Deguchi M, Yamashita N, Kagita M, et al. Quantitation of hepatitis B surface antigen by an automated chemiluminescent microparticle immuno J Virol Methods. 2004; 115: 217-222.
- Bedossa P, Poynard An algorithm for the grading of activity in chronic hepatitis C. Hepatology. 1996; 24: 289-293.
- Samant H, Joshi A, Abraham P, et al. Correlation of Quantitative HbsAg with Quantitative HBV DNA in Different Phases of Chronic Hepatitis B (CHB) Patients 2/5. J Liver Res Disord Ther. 2016; 1: 00014.
- Ndububa DA, Ojo OS, Adetiloye VA, et Chronic hepatitis in Nigerian patients: a study of 70 biopsy-proven cases. West Afr J Med. 24: 107-111.
- Uchenna O, Ruth B, Ogbu N, et al. Characteristics of Hepatocellular Carcinoma in Two Tertiary Hospitals in Nigeria -Has anything Changed? Int J Sci. 2016; 5: 43-48.
- Baig S. Gender disparity in infections of Hepatitis B virus. J Coll Physicians Surg Pak. 2009; 19: 598-600.
- Ndububa DA, Ojo OS, Adeodu OO, et al. Primary hepatocellular carcinoma in Ile-Ife, Nigeria: a prospective study of 154 cases. Niger J Med. 2001; 10: 59-63.
- Yang F, Yin Y, Wang F, et al. An Altered Pattern of Liver Apolipoprotein A-I Isoforms Is Implicated in Male Chronic Hepatitis B Progression. J Proteome Res. 2010; 9: 134-143.
- Iloh GUP, Chuku A, Amadi AN, et al. Risk Factors For Hepatitis B Virus Infection Among Adult Nigerians With Clinical Features Of Liver Diseases In A Resource-Constrained Environment Of A Primary Care Clinic In Eastern Nigeria. Sci J Clin Med. 2013; 2: 98.
- Tremeau-Bravard A, Ogbukagu I, Abubaka Seroprevalence of Hepatitis B and C among HIV-positive population in Abuja Nigeria. African Heal Sci. 2012; 12: 312-317.
- Diktas H, Karacaer Z, Özturk II, et al. Comparison of relationship between histopathological, serological and biochemical parameters in patients with chronic hepatitis B infection. Postgrad Med J. 2016; 92: 693-696.
- Jennifer, H. MacLachlan Benjamin CC. Hepatitis B Virus Epidemiology. Cold Spring Harb Perspect Med. 2015; 5:
- Maryam K, Seye MA, Heidar S. Comparison of Serum Hepatitis B Virus DNA and HBsAg Levels Between HBeAg- Negative and HBeAg-Positive Chronic Hepatitis B Patients. Jundishapur J Mocrobiology. 2015; 8: 2144.
- Jaroszewicz J, Calle Serrano B, Wursthorn K, et al. Hepatitis B surface antigen (HBsAg) levels in the natural history of hepatitis B virus (HBV)-infection: a European perspective. J Hepatol. 2010; 52: 514-522.
- Zeng D-W, Zhang J-M, Liu Y-R, et al. A Retrospective Study on the Significance of Liver Biopsy and Hepatitis B Surface Antigen in Chronic Hepatitis B Infection. Medicine (Baltimore). 2016; 95: 1-7.
- Tuaillon E, Mondain A-M, Nagot N, et al. Comparison of Serum HBsAg Quantitation by Four Immunoassays, and Relationships of HBsAg Level with HBV Replication and HBV Tavis JE, editor. PLoS One. 2012; 7: 32143.
- Kew Aetiology and Pathogenesis. In: Hepatocellular Carcinoma in Sub-Saharan Africa. 1st ed. USA: Trasfford Publishing; 2012; 109-204.
- Nwokediuko Chronic hepatitis B: management challenges in resource-poor countries. Hepat Mon. 2011; 11: 786-793.
- Brunetto A new role for an old marker, HBsAg. J Hepatol. 2010; 52: 475-477.
- Keshvari M, Alavian SM, Sharafi H. Comparison of Serum Hepatitis B Virus DNA and HBsAg Levels Between HBeAg- Negative and HBeAg-Positive Chronic Hepatitis B Patients. Jundishapur J Microbiol. 2015; 8: 21444.
- Jing M, Xu M, Zhang R, et al. Association between serum level of Hepatitis B e-antigen and severity of liver Int J Clin Exp Med. 2018; 11: 3542-3550.
- Ganji A, Esmaeilzadeh A, Ghafarzadegan K, et Correlation between HBsAg quantitative assay results and HBV DNA levels in chronic HBV. Hepat Mon. 2011; 11: 342-345.
- Harrison TJ, Ducheiko GM, Zuckerman AJ. Hepatitis Virus. In: Zuckerman AJ, Banatvals JE, Pattison JR, Griffiths PD, Schoub BD, editors. Principles and Practices of Clinical Virology. Third. John Wiley & son Ltd; 1994; 199-247.
- Anouar T, Bandar A-J. Correlation Between HBsAg Quantification and HBV DNA in HBeAg-Negative HBV/D Patients. saudi J Gastroenterol. 2013; 19: 243-244.
- Wang H, Yan R, Zhou Y, et al. Comparison of hepatitis B surface antigen and e antigen in predicting liver histology in hepatitis B e antigen-positive chronic hepatitis B patients. Hepatol Int. 2014; 8: 216-223.
- Shao J, Wei L, Wang H, et al. Relationship between hepatitis B virus DNA levels and liver histology in patients with chronic hepatitis B. World J Gastroenterol. 2007; 13: 2104-2107.
- Gao Y, Zou G, Ye J, et al. Relationship between hepatitis B surface antigen, HBV DNA quantity and liver fibrosis Chinese J Hepatol. 2015; 23: 254-257.
- Fateen AA, Shahin RY, Farres MN, et al. Assessment of hepatic fibrosis and necroinflammation among inactive HBsAg carriers in Egypt. Ann Hepatol. 2012; 11: 464-470.
- El-Zayadi A-R, Badran HM, Saied A, et al. Evaluation of Liver Biopsy in Egyptian HBeAg-Negative Chronic Hepatitis B Patients at Initial Presentation: Implications for Therapy. Am J Gastroenterol. 2009; 104: 906-911.