Comparing The Ratio Of Femoral Vein Diameter To Femoral Artery Diameter With Pulse Pressure Variation As A Diagnostic Tool For Fluid Responsiveness In Mechanically Ventilated Patient: A Prospective Observational Study
Author'(s): Mohamed Ahmed Hamed*, Maged Labib Boules, Mohamed Ibrahim Kamalelden Mahmoud and Rana Ahmed Abdelghaffar
Department of Anesthesiology, Faculty of Medicine, Fayoum University, Fayoum, Egypt.
*Correspondence:
Mohamed Ahmed Hamed, MD, Department of Anesthesiology, Faculty of Medicine, Fayoum University, 63511, Fayoum, Egypt, Tel: 0-111-856-0065.
Received: 01 Apr 2024; Accepted: 03 May 2024; Published: 11 May 2024
Citation: Hamed MA, Boules ML, Mahmoud MIK, et al. Comparing The Ratio Of Femoral Vein Diameter To Femoral Artery Diameter With Pulse Pressure Variation As A Diagnostic Tool For Fluid Responsiveness In Mechanically Ventilated Patient: A Prospective Observational Study. Anesth Pain Res. 2024; 8(1): 1-6.
Abstract
Background: There is a correlation between CVP and the femoral vein diameter. Therefore, we assessed the accuracy of the measurement using pulse pressure variation in patients on mechanical ventilation by measuring the ratio of femoral vein diameter to femoral artery diameter.
Methods: We enrolled 60 patients with circulatory failure who were on mechanical ventilation (MV) in our clinical research.
Two groups of patients were randomly assigned: Group (P): Thirty patients were placed on fully regulated mechanical ventilation, momentarily drugged, and paralyzed. At baseline, PPV is computed directly on Nihon Kohden monitors. Group (F): (n = 30), FVD/FAD ratio guided;The FVD/FAD ratio in our target group (F) was evaluated at baseline, The main outcome was the variation in MAP (mm Hg) following a three-hour infusion of liquids.
Results: There was a statistically significant difference in mean arterial pressure (MAP) between before and after the patients received their fluids. MAP was 57.13 ± 2.46 before receiving the fluids, but it increased by an average of 20.60, p-value<0.001. Similarly, there was a statistically significant difference in the FVD/FAD ratio before and after the patients received their fluids. The mean FVD/FAD ratio was 0.91 ± 0.13 before receiving the fluids, but after the patients received their fluids, the mean FVD/FAD ratio was 1.27 ± 0.16 after receiving the fluids.
Conclusion: The FVA/FAD ratio is a good indicator to assess the volume status of the patient who received fluids for resuscitation but should be confirmed by other parameters in hypovolemic-pre-resuscitated patients.
Highlights
• Assessement the accuracy of the measurement using pulse pressure variation in patients on mechanical ventilation
• The state of blood volume can be determined using both invasive and non-invasive techniques.
The FVA/FAD ratio is a good indicator to assess the volume status of the patient who received fluids for resuscitation.
Keywords
Introduction
When assessing critically ill patients, it is important to accurately determine the volume status of the patient and whether or not they will respond to a fluid challenge by raising their cardiac output [1,2].
When hypovolemia is detected, volume expansion is utilized to restore hemodynamics and bring blood pressure back to normal [3]. According to the Starling rule, which postulates a positive relationship between cardiac muscle fiber length and contractility, increasing preload by consuming more fluid will raise cardiac output. However, the Starling curve plateaus after its ascending leg, and administering more fluids may pose a risk due to the potential for right ventricular overload and pulmonary edema [4,5].
The state of blood volume can be determined using both invasive and non-invasive techniques. Measures such as central venous pressure (CVP) and mean pulmonary arterial pressure (mPAP) are examples of invasive approaches. CVP can be used as an indicator for fluid management, despite the fact that it might be misused to estimate blood volume or mislead therapeutic approaches [6].
Dynamic indicators, such as stroke volume variation (SVV) and pulse pressure variation (PPV), outperform static indices for assessing volume status. These dynamic indices become incorrect when a patient is ventilated with little tidal volume, as in the case of acute respiratory distress syndrome (ARDS), when the tidal volume is not adequate to significantly affect intrathoracic pressure [7]. Determining the fluid condition of the inferior vena cava (IVC) using an ultrasound (US) assessment may be helpful [8].
There are numerous factors that can significantly affect the ultrasound-based estimate of the IVC diameter, including abdominal trauma, elevated intra-abdominal pressure, obesity, and the position of the patient during the examination. Accurately measuring the superficial vein is not the same as accurately measuring the IVC diameter by the US. Fluid responsiveness (FR) is also predicted by a positive passive leg raising test (PLRT) [9]. IVC ultrasound assessment can be easily performed in subcostal and transhepatic views, both in mechanically ventilated and spontaneously breathing patients [4].
Researchers have looked for a different, non-invasive technique to measure the femoral vein diameter (FVD) in order to determine blood volume [10,11]. Investigations, however, show that the FVD and CVP have a respectable association. Furthermore, each FVD is unique and affected by a variety of characteristics, including height, BMI, sex, age, and other variables [12]. The measurement of the FVD/FAD ratio obtained via ultrasound was strongly correlated with CVP and mPAP, providing a non-invasive method for quickly and reliably assessing blood volume status and providing good clinical support [6].
We evaluated the FVD to femoral artery diameter (FAD) ratio in patients on mechanical ventilation and examined its accuracy using PPV in order to take these factors into account. We speculate that the FVD/FAD ratio will serve as a diagnostic tool to determine volume status and will be helpful in the evaluation of FR. The object of the current study is to evaluate FR in mechanically ventilated patients by measuring the ratio of FVD to FAD in mechanically ventilated patients using the US and comparing its accuracy with PPV as a noninvasive, rapid, and easy parameter.
Materials and Methods
In accordance with the principles of the Declaration of Helsinki, this prospective observational study was carried out in the intensive care units of Fayoum University Hospital from October 2022 to May 2023. The study design of Fayoum University Hospital (M591) was authorized by the ethical review board, and all eligible participants signed a comprehensive informed consent form. The research was carried out following registration on ClinicalTrials.gov (NCT05588180; Mohamed Ahmed Hamed was the main investigator; registration date: 20/10/2022; no protocol amendments or study modifications after trial initiation). This study complies with the relevant CONSORT recommendations.
Included were sixty patients, ages sixteen to sixty, who were on mechanical ventilation (MV) and had positive PLRT in addition to indicators of hypoperfusion (urinary flow < 0.5 mL/kg/h for > 24 hours, tachycardia > 100 beats/min, or skin mottling) [13]. A mean arterial pressure (MAP) of less than 65 mmHg or a systolic arterial pressure of less than 90 mmHg was considered to be indicative of circulatory failure.
The Exclusion Criteria Were Subjects With
- Cardiac
- previously known significant valvular disease or intracardiac shunt.
- air leakage through chest
- increased intra-abdominal
- norepinephrine infusion as it decreases PPV and SVV, masking their ability for the detection of FR [14].
- Peripheral vascular
- ARDS patients due to low tidal
- LVEF% less than 50%, acute pulmonary edema, cardiogenic shock, and renal patients with oliguria and volume overload, such as those receiving hemodialysis or experiencing acute anuric renal failure, are examples of contraindications for fluid
- Individuals who have lower limb varicose veins, substantial lower limb arterial plaque, lower limb occlusion, inferior vena cava filter implantation, and lower limb thrombosis.
All patients fulfilling the inclusion criteria were monitored by the standards monitor and then divided into 2 equal groups;
- Group (P) PPV
- Group (F) FVD/FAD ratio
Randomization and Blinding
- The website com was used to assign patients at random to each therapy group.
At no point during the study were the group allocations known to the participants, the study investigator, the attending clinicians, or the data collector; all allocations were concealed, and patient allocations were received in a sealed envelope that was opened after informed consent was obtained.
Group (P): Thirty patients were placed on fully regulated mechanical ventilation, momentarily drugged, and paralyzed. In order to ensure that the respiratory variations in arterial pressure exclusively represent the effects of positive pressure ventilation, the mechanical ventilator waveform monitor will not detect any spontaneous breathing attempts.Volume-controlled or pressure-controlled breathing modes were chosen based on the primary physicians' judgment. A minimum tidal volume of 8 ml/kg (estimated body weight) was established. At 14 breaths per minute, the respiratory rate was determined in advance. The range of the positive end-expiratory pressure (PEEP) was 8–10 cmh3O. A plateau pressure of less than 30 cmh3O was maintained.
PPV was computed directly on Nihon Kohden monitors at baseline after radial artery cannulation for invasive blood pressure monitoring (with a 20 G cannula) was performed on each patient. After three hours of infusion of 4 ml/kg/h of crystalloids, the PPV value was reevaluated.Group (F): (n = 30), guided by the FVD/FAD ratio, the US probe was utilized to locate the femoral artery's bifurcation position before retracting proximally. The bifurcation's visual field vanished as soon as the probe reached the femoral artery's main branch, at which point the vein and artery were visible at the same time. Under typical circumstances, the femoral vein and artery can both be identified by a pulse. After measuring the mean FVD and FAD, the FVD/FAD ratio was computed.
In our target group (F), the FVD/FAD ratio was measured at baseline, then 4 ml/kg/h crystalloid was infused for 3 hours, then the ratio was reassessed again. the cut-off to stop fluid administration is made on the disappearance of signs of circulatory failure, and the appearance of signs of fluid overload.
Measured parameters Primary outcome
MAP ( mm Hg) after 3hours of fluid infusion.
Secondary outcomes
- Cut-off value of FVD/FAD reflecting FR pre- and post-3-hour fluid infusion
- PPV pre-post 3-hour fluid infusion
- CVP (cm H2O) pre-post 3-hour fluid infusion
- SBP (mm Hg) pre- and post-3-hour fluid infusion
- DBP (mm Hg) pre- and post-3-hour fluid infusion
- HR (beat/min) pre- and post-3-hour fluid infusion
- lactate (mmol/L) pre- and post-3-hour fluid infusion
- UOP (ml) in 24 hours
Statistical Analysis and Sample Size Estimation
The sample size was established using a previous study by Lopes et al. [15], in which patients received fluid treatment guided by PPV. Using a power of 80% and an alpha of 0.05, a total sample size of 60 patients (30 in each group) was selected based on the difference in MAP. Descriptive statistics were presented as mean with standard deviation and median with interquartile range for numerical variables that were regularly distributed; percentages and numbers were used for categorical variables. An independent two-sample t-test was used to compare the outcome variables between the two groups if they were normally distributed; if not, the Mann-Whitney U test was employed. Fisher's exact test or the chi-square test were used to compare categorical variables. IBM SPSS 28 for Windows was used to perform the study, and a P-value of less than 0.05 was considered statistically significant.
Results
A total of 68 participants were evaluated for eligibility; 3 participants did not meet the inclusion criteria, and 5 participants met the exclusion criteria.
Data were analyzed for 30 patients in each group (Figure 1).

As regards patient characteristics, Group F included 30 participants (10 males and 20 females) with a mean age of 41.63 ± 15.96 years and a mean BMI of 29.80 ± 6.62 kg/m2, and they all had positive PLRT. Out of 30 patients, 9 (30%) were non-respondents.
The mean arterial pressure (MAP) in group F showed a statistically significant difference: before the patient received fluids, the mean MAP was 57.13 ± 2.46, but after the patient received fluids, the mean MAP jumped by an average of 20.60, p-value<0.001 table 1.
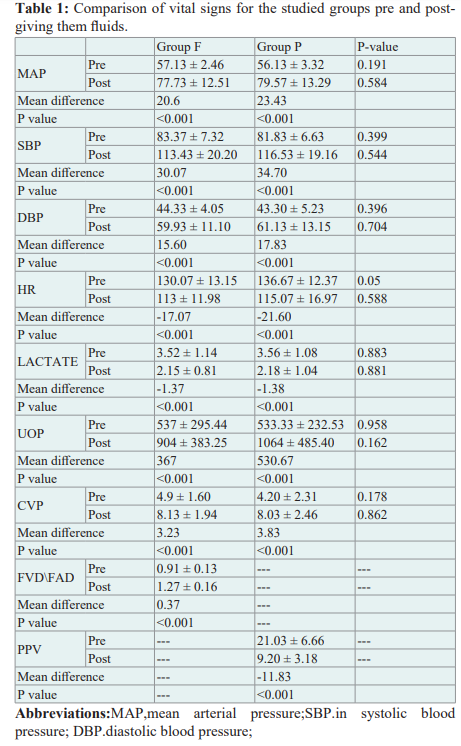
The lactate level showed a statistically significant difference: it was 3.52 ± 1.14 before the patient fluids were given, but it reduced by an average of -1.37, p-value<0.001, to 2.15 ± 0.81 after the patient fluids were given. Before patients received fluids, their mean FVD/FAD ratio was 0.91 ± 0.13; however, after receiving fluids, their mean FVD/FAD ratio increased by an average of 0.37, with a p-value of less than 0.001. This difference in the FVD/FAD ratio was statistically significant
In group P, the mean arterial pressure (MAP) increased by an average of 23.43, p-value<0.001, after the patients' mean MAP was 79.57 ± 13.29, compared to 56.13 ± 3.32 before the patients received fluids. This difference was statistically significant. The mean lactate level of the patients before receiving fluids was 3.56± 1.08; however, after the patients had fluids, it reduced by an average of -1.38, p-value<0.001, showing a statistically significant change in lactate levels.
Pre-giving the patients fluids resulted in a mean PPV level of 21.03± 6.66, which was reduced by an average of -11.83, p-value<0.001, after the patients received fluids. This difference in PPV level was statistically significant. There was no statistically significant difference seen between the two groups' pre- and post-fluid levels for MAP, SBP, DBP, HR, lactate, UOP, and CVP.
The FVD/FAD ratio of the patients in group F did not differ statistically significantly from their reaction to the fluids, with a p-value > 0.05. In contrast, a statistically significant difference was seen in group P, where the mean PPV level of respondent patients (mean = 22.29 ± 5.83) was higher than that of nonrespondent patients (mean = 16.00 ± 7.92), with a p-value of 0.036.
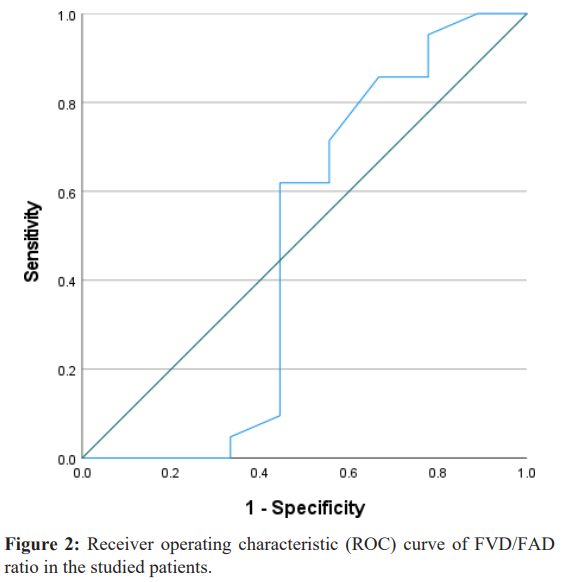
Figure 2 demonstrates that receiver operating characteristic (ROC) curve analysis was utilized to evaluate the clinical diagnostic accuracy of the FVD/FAD ratio prior to fluid administration for both respondent patients and non-respondent patients in group F. With a cutoff point level of ≥ 0.795, the FVD/FAD ratio detected the non-respondent state with a non-statistically significant level with 86% sensitivity (true positive cases) and 33% specificity (true negative cases). The findings of the ROC curve analysis revealed a p-value of 0.856.
As demonstrated in Table 2, receiver operating characteristic (ROC) curve analysis was used to assess the clinical diagnostic accuracy of PPV-level pre-giving fluids to patients in predicting the response status. Figure 3 shows the results of the PPV level (ROC) curve analysis, which showed a p-value of 0.034, so the PPV level was capable of discriminating the


Discussion
In our investigation, the mean artery pressure (MAP) readings before and after the patients received fluids varied statistically significantly between the two groups. We came to the conclusion that, although the ratio was a reliable indication of volume status in post-resuscitation patients who received fluids—as demonstrated by the p-value of 0.856 in the FVD/FAD ratio (ROC) curve analysis—it should be verified by additional measures in patients who were hypovolemic during resuscitation. The FVD/FAD ratio identified the non-respondent condition at no statistically significant level, with an 86% sensitivity (true positive cases) and 33% specificity (true negative instances) at a cutoff point level ≥ 0.795.Nedel WL, Simas DM, Marin LG, Morais VD, and Friedman G
[16] discovered in their study that the femoral vein had a limited ability to predict fluid response in patients experiencing septic shock and that there was no correlation between the femoral vein collapsibility and inferior vena cava collapsibility in patients experiencing spontaneous MV.
Despite minor measurement errors, Kent A, Patil P, Davila V, et al. [17] found that there are only weak associations between IVC-CI and FV-/IJV-CI in their research. These results imply that IJ-CI and FV-CI shouldn't be the primary intravascular volume measurement tools for clinical decision support in the intensive care unit.
In their study, Kim D-W, Chung S, Kang W-S, and Kim J [18] discovered that predicting fluid responsiveness in patients in critical condition could be done with a good degree of diagnostic accuracy using ultrasonographic assessment of the respiratory fluctuation in the IVC diameter. Nonetheless, we concluded that there is insufficient data for the IJV, SCV, and FV diameters to be used in clinical settings.
While the results of Ma Z, Gai J, Sun Y, et al. [6] revealed a significant connection with CVP, the measurement of the FVD/ FAD ratio obtained via ultrasound was strongly correlated with CVP and mPAP, providing a non-invasive method for quickly and reliably assessing blood volume status and providing good clinical support [6].
In critically ill patients (Malik A, Akhtar A, Saadat S, and Mansoor S [19], FVD was found to be substantially correlated with CVP readings, indicating a potential alternative non-invasive method for assessing volume status.
The findings of this exploratory work, as presented by Roy J. Cho, David R. Williams, and James W. Leatherman [10], suggest that FVD may provide an alternative approach when imaging the IVC is difficult and that its accuracy for predicting CVP is comparable to that reported for IVC ultrasound. They conducted all of their research on patients with high CVP, whereas our study focused on hypovolemic individuals who had low CVP and almost identical FVD and FAD sizes. As a result, no significant difference in the FVD/FAD ratio was seen in these patients prior to receiving fluids. The FVD/FAD ratio showed a substantial difference following the patient's administration of a certain volume, which increased both the patient's CVP and FVD. As a result, the ratio was associated with high CVP.
Limitations
First, with the small sample size of the studied groups, we will increase the study of hypovolemic patients in the follow-up study to further verify the effectiveness of this method. Second, we did not measure the cardiac output, which is the best method to differentiate between fluid responders and non-responders. Third, the length of stay was affected by other associated pathologies, so it was excluded from our study, and finally, the single-center setting and the observational design of the study.
Conclusion
The FVA/FAD ratio was a good indicator to assess volume status in patients who received fluids but should be confirmed by other parameters in hypovolemic pre-resuscitated patients.
References
- Kobe J, Mishra N, Arya VK, et Cardiac output monitoring: Technology and choice. Ann Card Anaesth. 2019; 22: 6-17.
- Kalantari K, Chang JN, Ronco C, et al. Assessment of intravascular volume status and volume responsiveness in critically ill patients. Kidney Int. 2013; 83: 1017-1028.
- Monnet X, Marik PE, Teboul JL. Prediction of fluid responsiveness: an update. Ann Intensive Care. 2016; 6: 111.
- Sanfilippo F, La Via L, Dezio V, et al. Inferior vena cava distensibility from subcostal and trans-hepatic imaging using both M-mode or artificial intelligence: a prospective study on mechanically ventilated patients. Intensive Care Med Exp. 2023; 11: 40.
- Kattan E, Ospina Tascón GA, Teboul JL, et al. Systematic assessment of fluid responsiveness during early septic shock resuscitation: secondary analysis of the ANDROMEDA- SHOCK trial. Crit Care. 2020; 24: 23.
- Ma Z, Gai J, Sun Y, et Measuring the ratio of femoral vein diameter to femoral artery diameter by ultrasound to estimate volume status. BMC Cardiovasc Disord. 2021; 21: 506.
- Myatra SN, Prabu NR, Divatia JV, et The Changes in Pulse Pressure Variation or Stroke Volume Variation After a “Tidal Volume Challenge” Reliably Predict Fluid Responsiveness During Low Tidal Volume Ventilation. Crit Care Med. 2017; 45: 415-421.
- Muller L, Bobbia X, Toumi M, et al. Respiratory variations of inferior vena cava diameter to predict fluid responsiveness in spontaneously breathing patients with acute circulatory failure: need for a cautious use. Crit Care. 2012; 16: 188.
- Monnet X, Bleibtreu A, Ferré A, et al. Passive leg-raising and end-expiratory occlusion tests perform better than pulse pressure variation in patients with low respiratory system compliance. Crit Care Med. 2012; 40: 152-157.
- Cho RJ, Williams DR, Leatherman JW. Measurement of Femoral Vein Diameter by Ultrasound to Estimate Central Venous Pressure. Ann Am Thorac Soc. 2016; 13: 81-85.
- Douglas IS, Alapat PM, Corl KA, et al. Fluid Response Evaluation in Sepsis Hypotension and Shock: A Randomized Clinical Trial. Chest. 2020; 158: 1431-1445.
- Fronek A, Criqui MH, Denenberg J, et al. Common femoral vein dimensions and hemodynamics including Valsalva response as a function of sex, age, and ethnicity in a population J Vasc Surg. 2001; 33: 1050-1056.
- Biais M, Ehrmann S, Mari A, et Clinical relevance of pulse pressure variations for predicting fluid responsiveness in mechanically ventilated intensive care unit patients: the grey zone approach. Crit Care. 2014; 18: 587.
- Hasanin Fluid responsiveness in acute circulatory failure. J Intensive Care. 2015; 3: 50.
- Lopes MR, Oliveira MA, Pereira VO, et Goal-directed fluid management based on pulse pressure variation monitoring during high-risk surgery: a pilot randomized controlled trial. Crit Care. 2007; 11: 100.
- Nedel WL, Simas DM, Marin LG, et Respiratory Variation in Femoral Vein Diameter Has Moderate Accuracy as a Marker of Fluid Responsivity in Mechanically Ventilated Septic Shock Patients. Ultrasound Med Biol. 2017; 43: 2713-2717.
- Kent A, Patil P, Davila V, et al. Sonographic evaluation of intravascular volume status: Can internal jugular or femoral vein collapsibility be used in the absence of IVC visualization?. Ann Thorac Med. 2015; 10: 44-49.
- Kim DW, Chung S, Kang WS, et al. Diagnostic Accuracy of Ultrasonographic Respiratory Variation in the Inferior Vena Cava, Subclavian Vein, Internal Jugular Vein, and Femoral Vein Diameter to Predict Fluid Responsiveness: A Systematic Review and Meta-Analysis. Diagnostics (Basel). 2021; 12:
- Malik A, Akhtar A, Saadat S, et Predicting Central Venous Pressure by Measuring Femoral Venous Diameter Using Ultrasonography. Cureus. 2016; 8: 893.
- Sanfilippo F, La Via L, Dezio V, et al. Assessment of the inferior vena cava collapsibility from subcostal and trans- hepatic imaging using both M-mode or artificial intelligence: a prospective study on healthy Intensive Care Med Exp. 2023; 11: 15.