Insulin Secretion in Extended Mixed-Meal Tolerance Test in the Context of the Four Phases of Digestion
Author(s): Wael F. Nassar1, Mervat El-Ansary2, Ahmed Fathy3, Mayar Nassar4, Omar W. Nassar5
1Department of Internal Medicine, Nephrology & Diabetes Section, Faculty of Medicine, October-Six University, Giza, Cairo, Egypt.
2Department of Clinical Pathology, Stem Cell Unit, Faculty of Medicine, Cairo University, Cairo, Egypt.
3Department of Interventional Radiology, National Institute of Nephrology & Urology, General Organization of Teaching Hospitals and Institutes (GOTHI), Cairo, Egypt.
4Department of Dermatology and Andrology, Faculty of Medicine, October-Six University, Giza, Cairo, Egypt.
5Senior House-officer, Faculty of Medicine, Cairo University, Cairo, Egypt.
*Correspondence:
Wael F. Nassar, Department of Internal Medicine, Nephrology & Diabetes Section, Egypt.
Received: 18 Aug 2023 Accepted: 23 Sep 2023 Published: 29 Sep 2023
Citation: Nassar WF, El-Ansary M, Fathy A, et al. Insulin Secretion in Extended Mixed-Meal Tolerance Test in the Context of the Four Phases of Digestion. Diabetes Complications. 2023; 7(1); 1-8.
Abstract
Background: A sequential response of insulin secretion is likely to follow the sequential pattern of digestion to optimize the effect of insulin and other counter regulatory peptides on the target tissues to maintain optimum insulin signaling pathway activation. Therefore, it is likely to relate insulin secretory response to the corresponding phase of digestion.
Patients and methods: Plasma glucose, insulin and glucagon levels of three groups, each comprises of 10 persons. Group “N” for normal, group “P” for pre-diabetic and group “D” for type 2 diabetes individuals. Fluctuations in insulin secretion, in relation to changes of plasma glucose levels throughout the four phases of digestion will be traced, changes in glucagon levels will be also evaluated.
Results: Early in the gastric-filling phase insulin was decreasing while glucose was rising, whereas, early in the gastric-emptying phase, insulin was rising while glucose was decreasing. Statistical significance of glucagon changes was higher than that of insulin between groups.
Conclusion: Factors, which regulate insulin secretion during the gastric-filling phase, may differ than those during the gastric emptying-phase. Insulin/Glucagon ratio, is more contributed, than insulin alone, to the metabolic abnormalities associated with diabetes. It is more informative to consider insulin secretion in relation to the corresponding phase of digestion. Therefore, a four- phase cycle of insulin secretion may be suggested.
Keywords
Introduction
Diabetes mellitus is a complex progressive disease. Insulin can increase hepatic glucose uptake by stimulating glucokinase activity and can also reduce hepatic glucose secretion by reducing glucose-6-phosphatase (G-6-Pase) [1]. Glucagon in concentrations, as low as 1013M, a level, which is far beyond the common available bioassays, may increase hepatic glucose output [2]. Plasma glucagon level has been also demonstrated to play an important role to maintain fasting plasma glucose [3].The ability of glucagon to regulate hepatic glucose production is mediated through activation of the cAMP/PKA signaling pathway [4]. Insulin also regulate, but oppose, these pathways [5]. Insulin-mediated reduction in endogenous glucose production occur rapidly, within minutes, even in individuals with T2DM [6]. Glycogen-derived hepatic glucose production includes both glycogenolysis and gluconeogenesis. Gluconeogenesis contributes more during fasting state. Activation of gluconeogenesis by glucagon requires glucose precursors, primarily lactate, alanine and glycerol. The delivery of such compounds to the liver needs longer time of fasting to reduce plasma insulin and disinhibit lipolysis and proteolysis. Besides, the production of these compounds is not regulated by glucagon [7]. However, regulation of hepatic glucose production by glycogen is known to occur in the context of hepatic insulin action [5]. Because insulin secretion is known to be initiated by nutritional substrates, abnormal meal habits are expected to disturb insulin secretion. Frequent eating occasions, which is demonstrated to contribute more than caloric density and portion size to changes in energy intake [8], may result in overlap of the digestive phases. This overlap is expected to be directly disturb insulin secretion. Fluctuation of insulin and glucagon throughout the four digestive phases has not thoroughly investigated in humans. This issue will be addressed in this work.
Patients and methods
Between March 2019 and March 2023, three groups, each includes ten persons, have been enrolled in this study. Ten normal volunteers (group “N”), ten pre-diabetic (group “P”) and ten T2DM (group “D”) individuals of less than 5 years duration, were enrolled in this study. Fluctuations of insulin, glucagon and glucose levels were recorded, and curves of a mixed-meal tolerance test (MMTT) were illustrated to study how can each parameter affect in, and is affected by the other parameters. The protocol was approved by the “Ethical Medical Committee” of the Faculty of Medicine, October Six University, on January 2019. Informed written consents were obtained from all subjects.
“N” group, ten males, age between 18-25 years, body mass index (BMI) between 24-26 kgm/m, no history of chronic illnesses, eight-hours fasting blood sugar (FBS) < 90 mg/dl, two hours blood sugar < 140 mg/dl and glycosylated hemoglobin (HbA1c) of less than 5.4 mmol/l. Normal bowel habits for at least one week before the procedure. All individuals show normal triglycerides, high- density lipoprotein (HDL), low-density lipoprotein (LDL), kidney functions, liver functions and normal hormonal bioassay. “P” group, ten persons, all were obese males of body mass index (BMI) ranging between 29-34 kgm/m with (FBS) between 110-126 mg/ dl, 2 hours post-prandial blood sugar between 144-200 mg/dl and HbA1c between 6.5-8.0 mmol/l. Age range between 40-50 years, normal bowel habits for at least one week before the procedure. “D” group, ten males were typically T2DM individuals of not more than five years of diagnosis maintained on various glucose lowering protocols. FBS > 126 mg/dl, 2 hours post-prandial blood sugar > 200 mg/dl and HbA1c > than 8.0 mmol/l. No past history of autoimmune diseases or any other chronic illnesses.
It worthwhile to mention that out of seventeen, apparently normal volunteers, seven have shown abnormal insulin secretion during the first-phase (3 delayed and 4 absence of insulin peak). They were all excluded from the study.
The diet
A sandwich, of ~60 gm of bread containing ~60 gm of roasted meat and mixed green salad. The average caloric density of this sandwich is about 500 kcl. Individuals involved in the study are advised to eat this sandwich immediately after the fasting venous blood sample was taken.
Percutaneous Ultrasound-Guided Portal Vein Access
Ultrasound guidance is typically used in left portal vein approaches, although it can also be used in right portal vein approaches [9]. Typically, a 21- to 22-gauge needle is advanced under real- time ultrasound guidance either with an ultrasound guide or free hand. Once the needle tip is seen entering the target portal vein branch, the procedure switches to fluoroscopic guidance. Contrast is injected to confirm adequate placement of the needle in the target portal vein branch. A guidewire is advanced centrally into the main portal vein. When using a 21- or 22-gauge needle, a 0.018- inch guidewire (stainless-steel or nitinol guidewire can be used) is advanced through the access needle under fluoroscopy. The 0.018-inch guidewire is then upsized to a 0.035-inch working guidewire using a telescoped transitional sheath system, such as a micro- puncture kit with or without a metal stiffener (Cook Inc., Bloomington, IN), an AccuStick access system (Boston Scientific Corp., Natick, MA), or a Neff-set (Neff Percutaneous Access Set, Cook Medical Bloomington, IN) system (Cook). Once the 0.035- inch wire is advanced into the central portal veins (preferably the main portal vein), a definitive access vascular sheath is advanced over the 0.035-inch guide wire.
Samples
After 12 hours of overnight fasting, all glucose-lowering drugs were stopped 24 hours before the procedure (for the diabetic group). Percutaneous ultrasound-guided portal vein catheter was fixed the night before the procedure. Fasting samples were taken at zero time point and at 2 minutes intervals for the early 10 minutes (2, 4, 6, 8 &10). Then samples were taken at 30 minutes intervals till the end of the fifth hour (300 min.). Whole blood, 3 to 5 mL, is collected in a vacuum tube. Specimens are allowed to clot at room temperature for 15–30 min, then centrifuged at 1500 × g for 10 min. Insulin is stable for at least 1 month at –20°C and 1 year at -70°C [10]. Specimens should be processed within 1 hour of collection. All samples were examined for plasma glucose, insulin and glucagon levels.
Measurement of plasma glucose
Biochemical methods Plasma glucose was measured with a centrifugal analyser using a hexokinase method (COBAS-BIO, Roche, Wehvyn Garden City, UK) [11].
The Radioimmunoassay (RIA) for measurement of insulin
Plasma insulin was measured by a charcoal phase separation RIA using a laboratory guinea pig antiserum GPUR. Insulin standard was supplied by NIBSC, (Potters Bin; UK) mad intact and split proinsulins by Eli Lilly and Co., (Indianapolis, Ind., USA) [12,13].
The Enzyme-Linked Immunosorbent Assay (ELISA) for measurement of glucagon
Glucagon levels were measured using a previously validated sandwich ELISA (Mercodia: cat. no. 10-1281/1271, employing an N-terminal anti-glucagon antibody as capture antibody and a C- terminal-specific anti-glucagon antibody as detection antibody [14].
Statistical analysis
Statistical analysis was performed by using the t-tests, analysis of covariance (ANCOVA) tests as appropriate. A Covariance P-value of < 0.05 was considered significant. All results will be plotted in three illustrations to compare how each variant affects in, and is affected by other variants [15].
Results
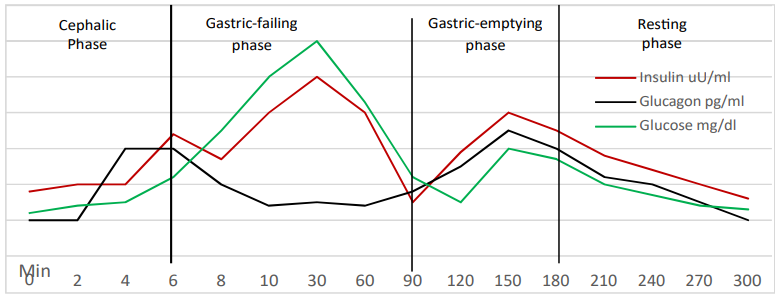
Figure 1: The “N” group
Plasma glucose level at zero time point, is 80 mg/dl, from zero to 4 min., plasma glucose was slowly rising. From 4 min. to 30 min., plasma glucose levels show abrupt rise where it reaches a peak of 135mg/dl at 30 min. after which glucose level was slowly declining until 150 min. where it shows a second rise with a peak of 100 mg/dl. Then plasma glucose was gradually declining to reach a level of 80 mg/dl at the end of the study period (300 min.).
Plasma insulin level at zero time point is 12 uU/ml. At 4 min. insulin level starts to show an abrupt rise reaching a peak of 30 µU/ ml at 6 min., after which it shows a gradual slow decline to a level of 25 µU/ml at 8 min. before it shows a steady rapid rise to reach another peak of 60uU/ml at 30 min. Plasma insulin level was then declining and insulin level at 90 min. was 20 µU/ml. then it shows another rise to reach a third peak of 30 µU/ml at 150 min. After that plasma insulin was gradually and steadily declining to reach a level of 15 µU/ml at the end of the study period (300 min.).
Plasma glucagon level at zero time point is 200 pg/ml. At 2 min. glucagon start to rise showing a peak of 400 pg/ml at 4 min., a level which were maintained for 2 min. (at 6 min.), after which glucagon level starts to decline gradually to reach a level of 200 pg/ml at 10 min. Plasma glucagon level was then maintained around this level till 90 min. where it shows another gradual rise to reach a second peak of 300 pg/ml at 150 min. After that, glucagon levels were gradually declining to reach a level of 200 pg/ml at the end of the study period (300 min.).
Glucose-insulin crossings
Crossing means that one parameter moves in the opposite direction of the other per unit time, regardless the units of each. At 7 min., plasma glucose level crosses over the insulin (glucose was rising while insulin was declining), a point after which plasma insulin changes were strictly following changes of plasma glucose (i.e. insulin follows glucose). Whereas, at 90 min., plasma glucose level crosses over the insulin, but in the opposite direction (glucose was declining while insulin was rising), a point after which insulin does no longer follow glucose. This opposite crossing, which occurs at the beginning of the third-phase, suggests that, rules that govern insulin secretion during gastric-emptying phase have changed than that of the gastric filling-phase, suggesting that other initiators and potentiators might be involved, as well as undermining the prioritization of glucose in regulating insulin secretion during the gastric-emptying phase (the third-phase). Rasmussen, more than three decades ago, described these insulin changes as the third- phase of insulin secretion [16].
Insulin & glucagon peaks
A peak of glucagon is seen at 4 min., preceding a peak of insulin, which is seen at 6 min. Insulin peak, is followed by gradual decline of glucagon. This is simply explained by the counterbalancing effect of insulin on alpha-cells at the pancreatic islets. However, at 90 min., plasma insulin level was, as low as, 20 µU/ml and glucagon level was 200 pg/ml. Although both are secreted from the same islet, the pattern of glucagon/insulin rise during the gastric-emptying phase (third-phase) is different than that of the gastric filling phase, rising glucagon crosses over the rising insulin at ~ 100 min. reaching a peak of 300 pg/ml at 150 min., while rising insulin reach its peak of 100 mg/dl at 150 min. (observe the absence of the counterbalancing effect of insulin!). Glucagon concentration in the portal vein, during the first-phase of insulin secretion, has been demonstrated to be higher than in any other major vascular system [17]. On the other hand, insulin clearance in the splanchnic zone is reported to increased, while hepatic insulin metabolism is reduced during the first-phase in animal models [18]. Therefore, it is suggested that, during the first-phase, insulin may exhibit different pathway, other than that of glucagon, to reach the portal vein.
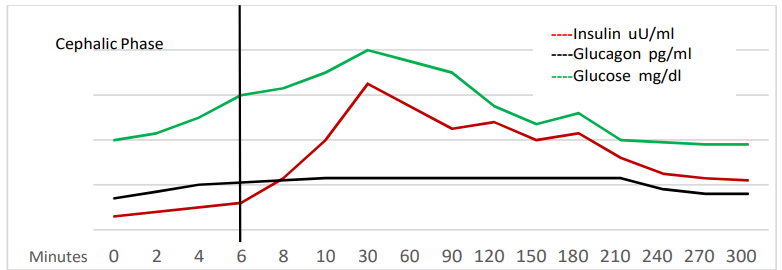
Figure 2: The “P” group
Plasma glucose level, at the zero time point is 115 mg/dl. Start to gradually rise, reaching 120 mg/dl at 10 mim, reaching a peak of 145 mg/dl at 30 min., end of meal ingestion. At 120 min., plasma glucose starts to rise again to reach another lower peak of 115 mg/dl at 150 min. After that, plasma glucose is gradually declining to reach a level of 120 mg/dl at 300 min, the end of the study period.
Plasma insulin level at zero time point is below10 uU/ml. At 4 min, insulin level becomes 15 µU/ml (i.e. delayed first-phase). After that insulin levels rise gradually, but slower than the “N” group, to reach a peak of 75 µU/ml at 30 min. At 90 min, insulin level was 30 µU/ml. After that, insulin level shows another peak of 50 µU/ml at 120 min. and a third peak of 40 µU/ml was seen at 180 min. Insulin levels were then gradually and slowly declining to reach a level of 30 uU/ml at 300 min. Plasma glucagon level at the zero time point is 320 pg/ml, then it shows abrupt increase to a peak of 400 pg/ml at 10 min., after which glucagon levels were marginally fluctuating around this figure until 210 min. where it start to decline gradually and slowly to reach a level of 280 pg/ml at 300 min.(the end of the study period).
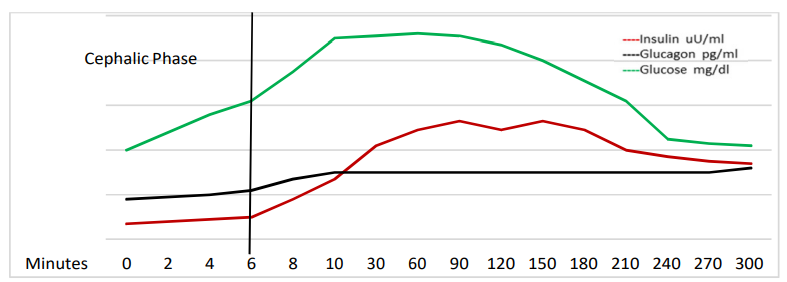
Figure 3: The “D” group:
Plasma glucose level at zero time point is 132 mg/dl, steeply rising to reach a peak of 165 mg/dl at 10 min. This peak was non- significantly fluctuating for about one hour, after which glucose levels started to decline at 120 min. to reach a level of 130 mg/ dl at 300 min. (the end of the study period). Plasma insulin level at 6 min. was 20 µU/ml, before which plasma insulin levels were below the level of 10 µU/ml (i.e. absence of first-phase). Insulin levels were then gradually increasing to reach a level of 50 µU/ ml at 90 min. After that, insulin starts to decrease gradually and slowly to reach a level of 20 µU/ml at 300 min. (the end of the study period). Plasma glucagon level at zero time point was 300 pg/ml at 10 min. It start to slowly rise to reach a peak of 450 pg/ ml at 10 min. Then it continues to fluctuate around this value with slight decline to reach a level of 300 pg/ml at 300 min (the end of the study period).
Table 1: The P values of changes of insulin and glucagon between the three groups. Note that P-value of < 0.05 was considered significant.
|
|
Group “N” |
Group “P” |
Group “D” |
|
Group “N” |
------------- |
0.92 Glucagon |
0.0006 Glucagon |
|
Group “P” |
0.087 Insulin |
------------ |
2.18E-07 Glucagon |
|
Group “D” |
0.5 Insulin |
0.12 Insulin |
-------------- |
Discussion
Insulin initiators and insulin potentiators
The absorbed nutrients posse the ability to initiate insulin secretory response and are, therefore, termed “insulin Initiators”. After a mixed meal, plasma glucose concentration occurs over a narrow range of 6-7 mml/l [19].This concentration of plasma glucose is a weak stimulus for insulin secretion. Therefore, stimuli other than glucose, are critically important for normal regulation of insulin secretion. These stimuli arise from different sources at different times and interact in a complex fashion to determine the pattern of change in insulin secretion and action [16]. The response to insulin initiators can be modified by a variety of hormones and neurotransmitters, which may amplify, and occasionally inhibit, insulin secretion and are therefore termed “insulin potentiators”.
The major physiological determinants of insulin secretion, in humans, are the circulating concentrations of glucose, free fatty acids (FFAs) and amino acids (AAs) [20]. Each nutrient is likely to initiate (its own) precise required amount of insulin, Highly specialized neuro- endocrinal cells of the gut, “K”, “I” cells; in the duodenum, and “L” cells, in the ilium, secrete GIP, CCK and GLP- 1 respectively, to potentiate (regulate) insulin secretion according to the absorbed nutrient.
Insulin is probably the most important hormonal factor influencing lipogenesis and lipolysis. High insulin levels inhibit lipolysis (e.g. postprandial state), whereas, low insulin levels increase lipolysis (e.g. fasting state) [21]. Insulin level at 90 min. in group “N” was 20 µU/ml, and in group “P” insulin level was higher, 30 µU/ml. whereas in group “D” insulin level was relatively very high, 50 µU/ ml. Hypoglycemia induced by exogenous insulin administration, inhibits lipolysis which is supposed to increase, resulting in activation of lipogenesis instead of lipolysis [1]. Besides, at glucose level > 8.0 mmol/l, β-cell loses its preferential selectivity and respond to high glucose and GLP-1, instead of responding to FFAs (as initiators) and GIP and CCK (as potentiatots), so that more glucose is produced, hence more insulin as well, and a vicious cycle develops. Therefore, not only postprandial hyperglycemia, but also postprandial hyperinsulinemia, is well contributed to postprandial dyslipidemia, an observation which need to be considered while treating dyslipidemia in those individuals.
In-group “N”, plasma glucose level at 10 min (early in the gastric- filling phase) was rising, while insulin level was also rising. In the contrary, at 90 min, plasma glucose level was declining, whereas, plasma insulin level was rising, along with rising plasma glucagon level. These results suggest that factors regulating insulin secretion during the gastric-filling are no longer functioning, and factors, other than glucose and GLP-1, may regulate insulin secretion during the gastric-emptying phase. FFAs, as initiators, and GIP as potentiator are likely to be suggested, as the chyme passes from the stomach to the duodenum. Rising of glucagon levels at 90 min. supporting this notion (effect of GIP). This insulin secretory pattern is distorted in group “P” and completely lost in group “D”. These data also account for the apparently phase-related selectivity of initiators and potentiators to regulate the release of a particular amount of insulin (and glucagon) which is required for a precise metabolic process. Therefore, relating the timing of release of initiators and potentiators, hence insulin secretory response, to various digestive phases rises the notion to describe insulin secretion into four-phase cycle, namely, cephalic, gastric filling, gastric emptying and resting- phases.
The Proposed Four-Phase Cycle of Insulin Secretion
The cephalic (neurogenic) phase, is 3-5 min. duration [16], purely neurogenic, against glucose gradient, and lasts till ingested glucose level can stimulate insulin secretory response, 5-10 min. Lagging of insulin secretion between 6-8 min. in the “N” group represent the transition from neurogenic-, to glucose-dependent insulin secretion. The second-phase corresponds to the gastric filling phase of digestion. During this phase, the absorbed glucose potentiates insulin secretion, while Glucagon-like peptide 1 (GLP- 1) potentiates insulin secretory response. GLP-1 is secreted from the enteroendocrinal “L” cells in the ilium in response to food mobilization by the gastro colic reflex following meal ingestion. The third-phase corresponds to the gastric-emptying phase of the digestion. As the chyme passes through the duodenum, the intraluminal pressure of the gut increases and is transmitted to the ilium to accelerate digestion and absorption of nutrients (other than glucose). Elevated levels of AAs, TG and FFAs, initiate a modified insulin secretory response at the level of β-cell. In addition, they will be taken up by liver cells and β-oxidation will be activated (lipolysis, which requires lower insulin level). Moreover, the passage of the chyme through the duodenum will mechanically stimulate the entero-endocrinal “K” cells to secrete glucose-dependent insulin peptide (GIP), and “I” cells to secrete cholecystokinin (CCK), to regulate secretion of both insulin and glucagon, which are likely to be essential for β-oxidation and fat metabolism at the hepatocyte. The fourth-phase follows complete evacuation of the stomach and lasts until the next meal is ingested. Only basal levels of both insulin and glucagon are required. Glucose level is supposed to be less than 5 mmol/l; a level which suits insulin biosynthesis at the β-cell. The longer the fourth-phase the better the replenishing of insulin stores and avoiding β-cell fatigue.
Phase over-lap
As it is related to digestive phases, insulin secretion may directly be influenced by meal habits. Frequent eating occasions, which is known to be the most contributed to obesity and T2DM, will delay gastric-emptying phase to allow more time for mixing and grinding the newly ingested food. Glucose content, of the newly ingested food, will be rapidly absorbed, and plasma glucose level will consequently rises (new first-phase overlaps the old third-phase). At plasma glucose level higher than 8 mmol/l, pancreatic β-cell loses its selectivity, so that insulin secretion continues to respond to glucose and GLP-1, instead of FFAs and GIP. The resultant hyperglycemia, hyperinsulinemia and FFAs (of the previous meal(s)) will, consequently, disturb the metabolic flexibility of the IDGUC, to shift from glucose-dependent; to lipid-dependent ATP synthesis. FFAs and TG accumulate inside the hepatocytes, fatty liver and non-alcoholic fatty liver disease (NAFLD) develop.
The hypothesis of the Pre-hepatic Duodeno-Portal (PDP) loop of insulin trans-circulation
Although both insulin and glucagon are secreted from the same islet, glucagon peak precedes insulin peak by 2 min in the first phase Figure (1). Moreover, between 2-4 min, both were increasing; nevertheless, the counterbalancing inhibitory effect of insulin to glucagon was missing. This observation may suggest that, both may not pass through the same pathway to reach the portal vein. Glucagon concentration during the first-phase has been demonstrated to be higher in the portal vein; than in any other major vascular system [22,23]. Besides, ingested glucose does not appear in blood before 5-10 min. of food ingestion [24,25], although, insulin clearance in the splanchnic zone has been reported to increase, while, hepatic insulin metabolism has been demonstrated to be reduced [26]. It has been reported that, 80% of the secreted insulin is extracted on first-pass, taken up by the liver and the rest (20%) reaches the systemic circulation [27]. This observation rises an important inquiry, how comes that 80% of secreted insulin cannot reduce hepatic glucose excursion?. Surprisingly, it has also been reported that hepatic glucose production is discerningly sensitive to a minute change in hepatic insulinization [28]. Knowing that insulin secretion may not differ between normal and pre-diabetic individuals.
Therefore, it may be hypothesized that insulin passes through a different pathway, other than that of glucagon, to reach the portal vein, mostly to the splanchnic zone (portal circulation), where insulin clearance is known to increase. It is also important to remember that, in normal physiological conditions, fasting plasma glucose of less than 5 mmol/l, cannot stimulate insulin secretory response or allow systemic circulation to transport such a relatively big amount of insulin to the active splanchnic zone, or otherwise hypoglycemia may occur. Therefore, a pre- hepatic duodeno- portal (PDP); pathway; loop (to bypass liver metabolism and avoid systemic rout for fear of hypoglycemia), may be hypothesized (Figure 4).
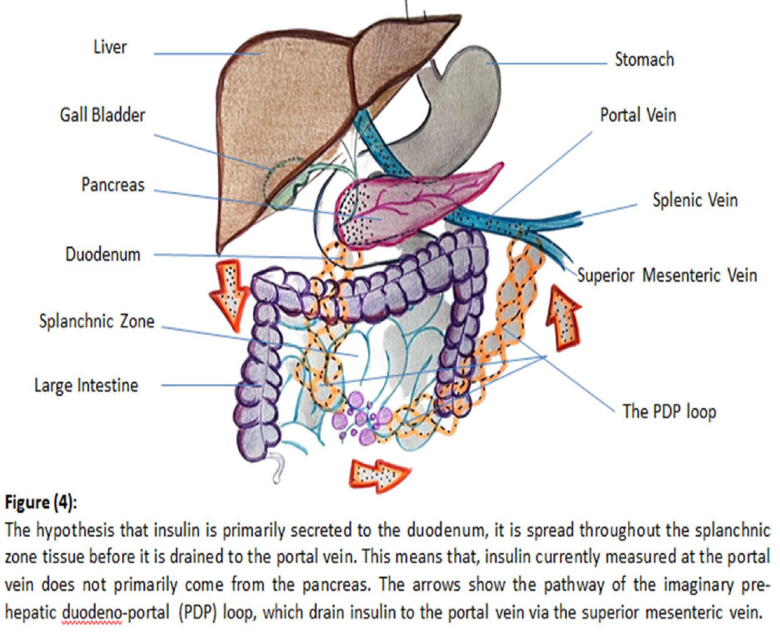
A host of observations have been in favor of the hypothesis of the (PDP) loop. The splanchnic zone is known to eventually dispose about 40% of the total ingested glucose, which emphasizes the high and continuous increasing need for insulin [29]. Intra- peritoneal injection of exogenous insulin has been reported to mimic physiological insulin secretion with characteristically rapid insulin absorption and near physiological carbohydrate and lipid metabolism along with avoidance of peripheral hyper- insulinemia [30]. The immediate improvement of the glycemic state and almost withdrawal of glucose lowering agents, following the procedures of bariatric surgery, even in individuals of long- standing type 2 diabetes [31,32], along with rapid reversibility of hepatic insulin resistance [33], may suggest that the nature of the disease is a defect of a concentration gradient of mediators (e.g. I/G ratio), which can be immediately restored, rather than an organic cell defect which may take longer time, if ever, to be restored. Knowing that insulin secretion may not differ between normal and pre-diabetic individuals, meaning that, insulin of the first-phase, is already secreted whether the first-phase is present or lost. Although factors, which favor the existence of the PDP loop, are conclusive, however, the pathway through which insulin can bypass the liver and go directly to the portal splanchnic zone is to be elucidated.
The first-phase of insulin secretion exhibits special characteristic features, which distinguish it from other phases, which may give a clue to solve this mysterious issue. Insulin secretion of the first- phase is known to be pulsatile in nature; in a very rapid high frequency, periodicity oscillations from the pre-docked readily releasable pool at the inner surface of the plasma membrane of the β-cell [34]. In addition, neuropeptide Y (NPY) and Galanin; neuro-peptides secreted with insulin, exhibit an inhibitory action to the secretory function of both endocrine and exocrine pancreas [35,36]. This may suggest that the very rapid high frequency periodicity oscillations may allow insulin; which is a known endocrine hormone; to pass through the pancreatic duct; exocrine pathway; to finally reach the duodenum where it can be diluted and immediately absorbed to the splanchnic zone before it is drained to the portal vein via the superior mesenteric vein (SMV), where it usually measured. The presence of portal venous communicating branch from the pancreas and the duodenum cannot be denied. It is important to remember that insulin granules from the readily releasable pool, are exocytosed in an insoluble (inactive) crystalline latex hexamer form, which need to be activated either by the effect of bile acids [37], or spontaneous dilution, before insulin crosses the capillary walls as monomers into blood circulation [38]. It is also important to remember that, in normal physiological conditions, the duodenum is supposed to be empty during the first-, and second-phase, so that the acidity of the gastric contents, and the alkalinity of the duodenal contents, can be avoided. Bile acid sequestrantes have been demonstrated to significantly reduce fasting, and post-prandial blood sugar and also glycated hemoglobin (HbA1c) and glycated albumin [39], which is in favor if this notion.
One more observation supports the hypothesis that insulin is primarily secreted directly to the duodenum, and not to the portal vein, is that the adipose tissue of the splanchnic zone is known to be lipolytically more active with much greater metabolic activity than other fat tissues in our body [40]. Relative higher insulin delivery to the splanchnic zone, activate lipogenesis, particularly with high caloric diet and frequent eating occasions, which result in trunkal obesity. If insulin arrives to splanchnic zone via the systemic circulation, then, all body fat tissues are expected to show the same lipolytic activity, which is not the case. These data may support the hypothesis of the endocrine-exocrine pathway of insulin secretion. Notice that insulin peak during the third-phase, 30 µU/ml) Figure (1), was not as high as that of the second-phase, but was also higher than the basal levels.
Conclusion and Recommendations
Not only postprandial hyperglycemia, but also postprandial hyperinsulinemia should be considered (i.e. reduced) while treating the metabolic abnormalities in prediabetic and diabetic individuals. The discrepancy between insulin and glucagon peaks, during the first-phase, may propose the presence of a different pathway for insulin to reach the portal vein, other than that of glucagon, Therefore, the Prehepatic Duodeno-Portal (PDP) loop may be hypothesized. The pattern of insulin-glucagon secretion during the third-phase underline the importance of GIP and CCK, during the third-phase, in regulating FFAs metabolism and prevention of fatty liver. Frequent eating occasions, per se, play a crucial role in the development and progression of diabetes and the associated metabolic abnormalities. These observations requires intensive research to explore innovative diagnostic and therapeutic modalities to prevent, or at least, halt the progression of diabetes.
Acknowledgements
I am grateful to the following entities for their contributions to this work:
- Ali Wael for his advice on producing informative figures and illustrations.
- Google's Bard, for helping me to fix many language mistakes in this work. I formally reviewed the content for accuracy and edited it as necessary, but I am sure that I would have missed many errors without its I take full responsibility for all the content of this publication, but I am confident that it is now much improved thanks to its efforts.
References
- Adrian Vella, Robert Rizza A. Metabolic Disturbances in John Wiley Sons Ltd. 2017; 15: 205-214.
- McGarry JD, Robles Valdes C, Fosre DW, et al. Role of carnitine in hepatic ketogenesis. Proc Natl Acad Sci USA. 1975; 72: 4385-4388.
- Jiang G, Zhang Glucagon and regulation of glucose metabolism. Am J Physiol Endocrinol Metab. 2003; 284: E671-E678.
- Wahern J, Ekberg Splanchnic regulation of glucose production. Annu Rev Nutr. 2007; 27:329- 345.
- Darleen Sandoval, Jenny Tong, David Alessio, et Glucagon in Islet and Metabolic Regulation. John Wiley Sons Ltd. 2017; 7: 103-113.
- Krssak M, Falk Petersen K, Dresner A, et Intramyocellular lipid concentrations are correlated with insulin sensitivity in humans a 1H NMR spectroscopy study. Diabetologia. 1999; 42: 113-116.
- Soeters MR, Soeters PB, Schooneman MG, et al. Adaptive reciprocity of lipid and glucose metabolism in human short term starvation. Am J physiol Endocrinol Metab. 2012; 303: E1397- E1407.
- Duffey KJ, Popkin BM. Energy Density Portion Size and Eating Occasions Contributions to Increased Energy Intake in the United States 1977–2006. PLoS 2011; 8: 1001050.
- Avritscher R, de Baere T, Murthy R, et al. Percutaneous transhepatic portal vein embolization rationale technique and Semin Intervent Radiol. 2008; 25: 132-145.
- Boch G, Dalla Mann C, Campioni M, et al. Insulin sensitivity insulin release and glucagon like peptide-1 levels in persons with impaired fasting glucose and impaired glucose tolerance in the EUGENE2 Diabetes. 2006; 55: 3536-3549.
- DeFronzo RA, Tobin JD, Andres R, et al. Glucose clamp technique a method for quantifying insulin secretion and Am J Physiol. 1979; 23: 7E214-E223.
- Graham TE, Wason CJ, Blüher M, et al. Shortcomings in methodology complicate measurements of serum retinol binding protein RBP4 in insulin resistant human subjects. 2007; 50: 814-823.
- Sobey WJ, Beer SE, Carrington CA, et Sensitive and specific two site immunoradiometric assays for human insulin proinsulin 56-66 split and 32-33 split proinsulins. Biochem J. 1989; 260: 535-541.
- Wewer Albrechtsen NJ, Hartmann B, Veedfald S, et Hyperglucagonaemia analysed by glucagon sandwich ELISA Nonspecific interference or truly elevated levels. Diabetologia. 2014; 57: 1919-1926.
- Egger M, Davey Smith G, Schneider M, et Bias in metaanalysis detected by a simple graphical test. BMJ Clin Res Ed. 1997; 315: 629-634.
- Howard Rasmussen, Kathleen Zawalich, Shridar Ganesan, Roberto Calle, Walter S. Zawalich. Physiology and Pathophysiology of Insulin Secretion. Diabetes Care 1990; 13: 655-665.
- Jaspan JB, Polonski KS, Lewis M, et al. Hepatic metabolism of glucagon in the dog contribution of the liver to overall metabolic disposal of glucagon. Am J Physiol. 1981; 240: E233-E244.
- Saha P, Vella A, Basu A, et Effects of free fatty acids and glycerol on splanchnic glucose metabolism and insulin extraction in nondiabetic humans. Diabetes. 2002; 51: 301- 310.
- Schmidt WE, Siegel EG, Creutzfeldt W, et al. Glucagon like peptide 1 but not glucagon like peptide 2 stimulates insulin release from isolated rat pancreatic Diabetologia. 1985; 28: 704-707.
- Ebert R, Creutzfeldt W. Gastrointestinal peptides and insulin Diabetes Metabolism Reviews. 1987; 3: 1-26.
- Klein S, Wolfe Effect of short and long term beta adrenergic blockade on lipolysis during fasting in humans. Am J Physiol. 1992; 262: 631-636.
- Dobbin RI, Davis SN, Neal DW, et Compartmental modeling of glucagon kinetics in the conscious dog. Metabolism. 1995; 44: 452-459.
- Butler PC, Rizza Contribution to postprandial hyperglycemia and effect on initial splanchnic glucose clearance of hepatic glucose cycling in glucose intolerant or NIDDM patients. Diabetes. 1991; 40: 73-81.
- Radziuk JNorwich KH, Vranic Experimental validation of measurements of glucose turnover in nonsteady state. Am J Physiol. 1978; 234: E84-E93.
- Shah P, Vella A, Basu A, et al. Effects of Free Fatty Acids and Glycerol on Splanchnic Glucose Metabolism and Insulin Extraction in Nondiabetic Humans. Diabetes. 2002; 51: 301-
- Ehud Arbit, Miriam Oral Insulin Delivery in a Physiologic Context Review. Journal of Diabetes Science and Technology. 2017; 11: 825-832.
- Edgerton DS, Cardin S, Emshwiller M, et al. Small increases in insulin inhibit hepatic glucose production solely caused by an effect on glycogen metabolism. Diabetes. 2001; 50: 1872-
- M Zander, S Madsbad, C F Deacon, et al. The metabolite generated by dipeptidyl peptidase 4 metabolism of glucagon like peptide 1 has no influence on plasma glucose levels in patients with type 2 diabetes. Diabetologia. 2006; 49: 369-
- Lee SI, Narendran Intraperitoneal insulin therapy for a patient with type 1 diabetes with insulin injection site inflammation. BMJ case Rep. 2014.
- Nannipieri M, Mari A, Anselmino M, et al. The role of beta cell function and insulin sensitivity in the remission of type 2 diabetes after gastric bypass J Clin Endocinol Metab. 2011; 96: E1372- E1379.
- Jan Peter Yska JP, Van Roon EN, De Boer A, et Remission of Type 2 Diabetes Mellitus in Patients After Different Types of Bariatric Surgery A Population Based Cohort Study in the United Kingdom. Obs Surg. 2016; 26: 2308-2315.
- Petersen KF, Oral EA, Dufour S, et Leptin reverses insulin resistance and hepatic steatosis in patients with severe lipodystrophy. J clin Invest. 2002; 109: 1345-1350.
- Rorsman P, Braun Regulation of insulin secretion in human pancreatic islets Annu Rev Physiol 2013; 75: 155-179.
- Ahren B. Autonomic regulation of islet hormone secretion implications for health and disease. Diabetologia. 2000; 43: 393-410.
- Dunning BE, Ahren B, Veith RC, et al. Galanin a novel pancreatic Am J physiol. 1986; 251: E127-E133.
- Schittenhelm B, Wagner R, Kahny V, et al. Role of FXR in beta cells of lean and obese mice. Endocrinology. 2015; 156: 1263-1271.
- Brange J, Owens DR, Kang S, et al. Monomeric Insulins and Their Experimental and Clinical Implications. Diabetes Care. 1990; 13: 923-954.
- Haeusler RA, Astiarraga B, Camastra S, et al. Human insulin resistance is associated with increased plasma levels of 12α hydroxylated bile Diabetes. 2013; 62: 4184-4191.
- Lee SI, Narendran Intra peritoneal insulin therapy for a patient with type 1 diabetes with insulin injection site inflammation. Case Rep. 2014; 2014205278.
- Duckworth SJ, Saudek CD, Henry RR, et al. Evolution of Insulin Delivery Devices From Syringes Pens and Pumps to DIY Artificial Diabetes. 1992; 41: 657-661.