Using Signal Processing Techniques to Predict PPG
Author'(s): Gerald C. Hsu*
eclaireMD Foundation, USA.
*Correspondence:
Gerald C. Hsu, eclaireMD Foundation, USA, E-mail: g.hsu@eclairemd.com.
Received: 02 June 2018 Accepted: 26 June 2018
Citation: Gerald C. Hsu. Using Signal Processing Techniques to Predict PPG. Diabetes Complications. 2018; 2(2): 1-4.
Keywords
Introduction
This paper discusses the methodology and accuracy of a developed PPG prediction model using signal processing techniques from electronics and communication engineering.
The author received an honorary PhD in mathematics and majored in engineering at MIT. He attended different universities over 17 years and studied seven academic disciplines including mathematics, engineering, computer science, business administration, and psychology. He has also worked in various industries including defense, nuclear power, computer-aided-design, computer hardware & software engineering, and semiconductor design.
He has spent 20,000 hours in T2D research. First, he studied six metabolic diseases and food nutrition during 2010 - 2013, then conducted research during 2014-2018. His approach is “math- physical medicine” based on mathematics, physics, engineering modeling, signal processing, computer science, big data analytics, statistics, machine learning, and artificial intelligence. This approach could provide quantitative data and precise results to interpret biomedical phenomena. His main focus is on preventive medicine for chronic disease control using five prediction tools developed during the period of 2015 - 2018, i.e. Weight, FPG, PPG, Adjusted Glucose, Estimated A1C. He believes that the better the prediction, the more control one would have over chronic disease.
Method
Regardless the argument on glucose testing method’s accuracy via either lab-tested A1C or finger piercing and testing strips, the author has collected a complete set of PPG data using lab- tested A1C and finger prick testing strips plus his created lifestyle data during a period of 1,075 days with 3,225 meals (6/1/2015 - 5/11/2018). This PPG-related data set, size of ~400,000 data, is only a small portion of his entire ~1.5 million data.
Due to his mathematics and engineering background, he views these data curves related to biomedical conditions and lifestyle management as a collection of various nonlinear input and output signal waves of the human body. At first, he applied “Finite Element Method” of engineering modeling to convert this “analog” human system into a “digitized” mathematical system in order to get an approximate solution of the real human system.
He sees each digitized sub-wave as representing a single-source created contribution element of the PPG wave. Therefore, he applied signal processing techniques to decompose this measured PPG signal into more than 10 single-sourced sub-waves. He carefully checked each sub-signal waveform for its completeness, accuracy, and correlation with other curves, using time-series, spatial, and frequency domain analyses, etc.
Over the past three years, he continuously explored and added some missing influential factors into the formation of the PPG signal. His purpose was trying to improve the predicted PPG waveform’s contents and accuracy while maintaining high correlation with the measured PPG waveform.
For example, by the fall of 2016, the accuracy of his predicted PPG reached ~95%. In September of 2017, he identified that weather temperature also had an impact on glucose value. Therefore, he selected a 2-year period (6/2015 - 7/2017) to examine his travel schedule in detail and also entered each day’s local ambient temperature of the city where he stayed. In this way, he was able to generate a new temperature sub-wave which brought the accuracy of the predicted PPG from ~95% to ~98%.
Another factor was that his glucose was quite high when he was sick with flu for a month at the end of 2017. After that experience, he further enhanced his prediction model with the inclusion of “physical sickness or wellbeing” which finally brought the prediction accuracy to 99.8%.
The author used his measured data as the base for data comparison. He has safeguarded the integrity of his data and has never altered its original content or influenced its integrity.
All data was collected in its entirety from one patient only, via a customized software, over an extended period of time. Therefore, the author needed very little “data cleaning” before starting his research work, which included data analysis and data interpretation. This project does not have to be concerned with problems such as data interference and data contamination due to different genetic conditions, various lifestyles, and contradicting interpretations. These data come from a consistent sample source, making it much easier for the author to dive into one variable and extract the buried information.
After analyzing each sub-wave in detail, he was ready to reintegrate these sub-waveforms into another nonlinear predicted PPG waveform.
He further improved his model via a “curve-fitting” trial-and-error engineering method. He has continuously compared these two sets of data and improved the accuracy until it reached a very high linear accuracy while still maintaining high correlation. High correlation means the trend of predicted curve moves along with the measured curve like its “twin”.
For A1C estimation, he specifically added in a “safety margin”, e.g. +15%, on top of his originally predicted A1C value for the purpose of providing a numerical buffer which can serve as an “early warning” to T2D patients. Both the Adjusted Glucose and Estimated A1C models also utilized “self-adjusting” machine- learning algorithms in order to correct or compensate for the built-in “error” from chemical process of various lab tests and glucometers.
Results
As shown in Figure 1, during the period of 1,075 days (6/1/2015 - 5/11/2018), average PPG values are:
Predicted: 119.82 mg/dL Measured: 119.98 mg/dL with 99.8% linear accuracy and a high correlation of 84%.
It should be noted that an overlapping period of 953 days (10/1/2015 - 5/11/2018) was used for calculating the 90-days moving average for easy viewing of the PPG trend (similar to the concept of “dynamic daily A1C”). The first 90-120 days data were not used in calculation due to the consideration of data stability.
As shown in Figures 1, 2 & 3, the PPG’s key influential factors’ contribution on daily PPG value and their individual contribution margins are as follows:
Carbs/Sugar: +14.5 mg/dL, 38% Post-meal walking: -15.8 mg/dL, 41% Temperature: +3.7 mg/dL, 10% All others: +1.9 mg/dL, 11% Net gain on PPG: +4.3 mg/dL As shown in Figure 1, Correlation coefficients between major influential factors and measured PPG (119 mg/dL) are:
Carbs/Sugar (14.8 gram): +55% (high positive value means higher intake of carbs/sugar pushes PPG higher)
Exercise (4200 steps): -66% (high negative value means higher amount of exercise brings PPG lower) As shown in Figure 3, temperature impact on PPG is obvious, especially in warmer weather >77°F. This PPG value would increase 0.9mg/dL due to temperature increase of each degree above 77°F. This phenomenon is due to increased energy demand and metabolism creation.
As shown in Figure 4, for an overweight patient (BMI 25 - 30), the correlation coefficient between PPG and Weight is a low 11% in time-series analysis. In spatial analysis diagram, his PPG values stay within a “constant band” regardless of his weight reduction. These two diagrams prove that PPG is not influenced by Weight. Also shown in the same Figure 4, the correlation coefficient between PPG and FPG is a mere 0.9% which means they are not related at all.

Figure 1: Predicted vs. Measured PPG and correlation between influential factors and PPG.

Figure 2: Decomposition of 4 Sub-Waveforms of PPG.
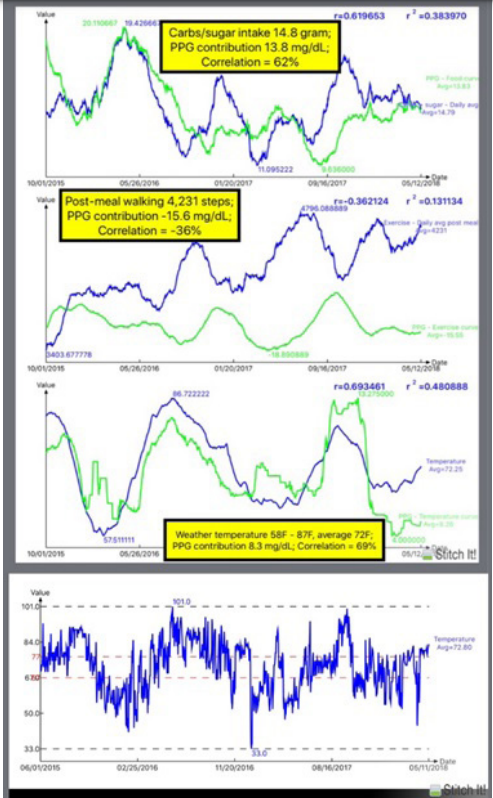
Figure 3: Influential factor’s contribution to PPG and Temperature Record.

Figure 4: Low correlation existed between PPG vs. FPG and PPG vs. Weight.
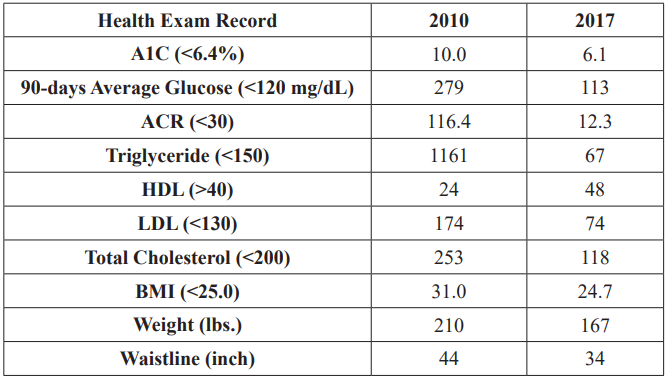
Figure 5: Health Data Comparison between 2010 and 2017.
As a result, both FPG and weight have no relationship and influence on PPG. On the other hand, as described in other papers written by the same author, weight is the primary factor of FPG. Weight is directly proportional to the total quantity of food consumption while PPG is directly related to food quality, specifically the intake amount of carbs and sugar. Of course, a person who eats a large quantity of food will likely take in more carbs and sugar. However, a knowledgeable and well-disciplined diabetic patient can control both quantity and quality of food. It should be noted that the above conclusion should be re-verified for light-weight and obese patients. Strict weight reduction will be a very effective way for an obese patient to put his/her glucose (both FPG and PPG) under control.
Conclusion
The quantitative results from the developed PPG prediction model reflect the accuracy and applicability for Type-2 diabetes control via a guided lifestyle management. The utilization of signal processing from electronics engineering is also proven quite effective for this investigation. As shown in Figure 5, Health Data Comparison Between 2010 and 2017, the author’s health condition has been improved significantly due to the control of his glucose, especially PPG.
Acknowledgement
First and foremost, I wish to express my deep appreciation to a very important person in my life, Professor Norman Jones at MIT.
Not only did he give me the opportunity to study at MIT, but he also trained me extensively on how to solve problems and conduct scientific research.
I would also like to thank Professor James Andrews at the University of Iowa. He helped and supported me tremendously when I failed academically at Iowa. He believed in me and prepared me for the undergraduate requirements which built my engineering foundation.